
Challenge
A US healthcare provider relied on information distributed across systems and reporting formats. Teams repeatedly assembled large presentation decks to explain different data points, making routine analysis slow and difficult to reproduce.
Approach
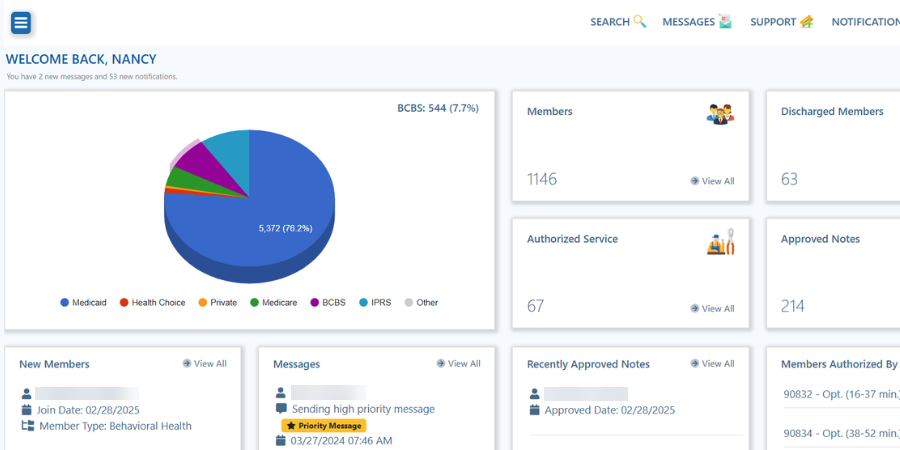
Batoi Build and open-source visualization components were used to create a filterable reporting workspace aligned with today’s Batoi Platform. The implementation brought agreed data into a shared view and allowed users to generate visual analysis without rebuilding presentation material for each question.
Access and data-handling controls were reviewed within the scope of the delivered application.
Outcome
- Teams could explore current information through filters instead of scanning hundreds of slides.
- Reports and insights became available on demand for the supported data set.
- The customer reported an approximately 25% reduction in manual reporting effort for the documented workflow.