
Guide navigation 11 of 15
Expected result
Accurate roll‑up figures rely on treating every metric the right way.
Accurate roll‑up figures rely on treating every metric the right way. In Batoi Insight, each numerical parameter belongs to one of two categories: Progressive or Regressive. Understanding the distinction ensures that project analytics are trustworthy and easy to read.
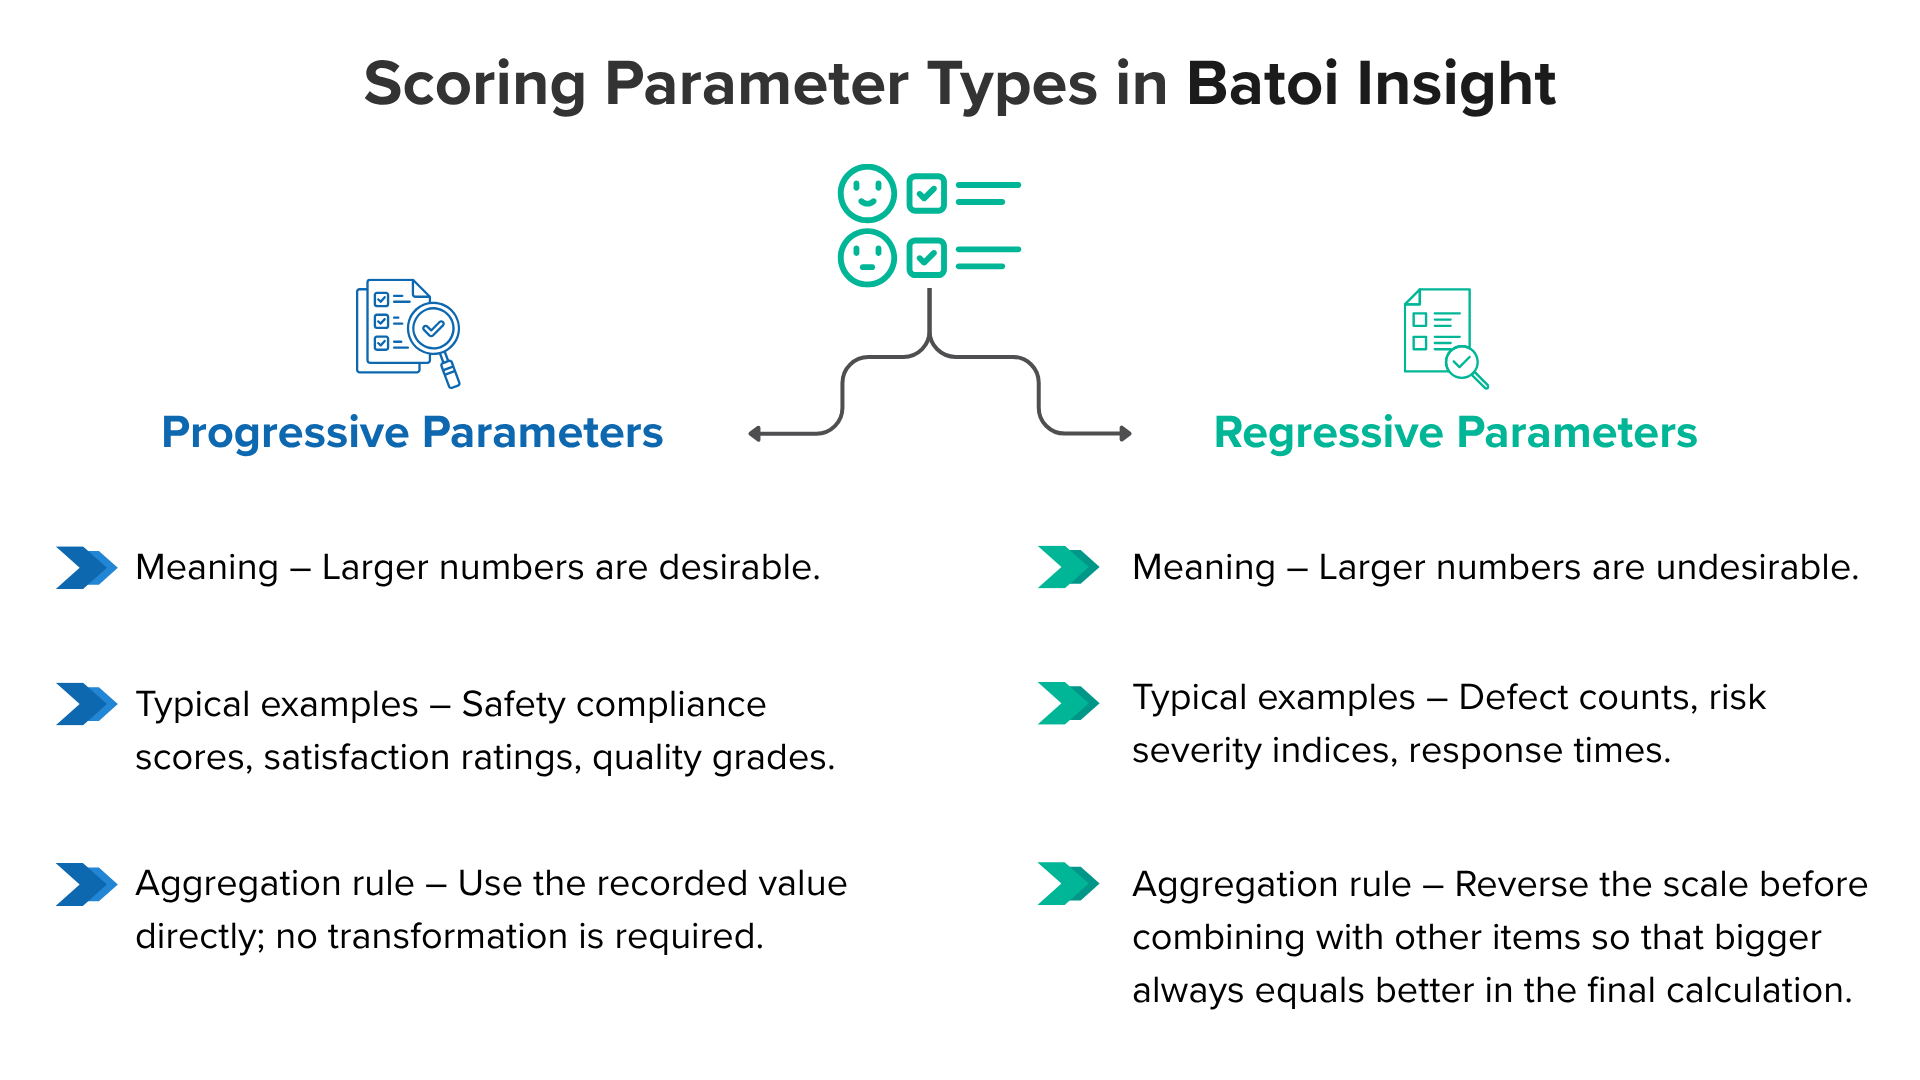
Progressive Parameters
- Meaning – Larger numbers are desirable.
- Typical examples – Safety compliance scores, satisfaction ratings, quality grades.
- Aggregation rule – Use the recorded value directly; no transformation is required.
When “5” on a 0–5 scale signals excellent performance, that value can be averaged or summed as‑is because a higher score already means a better outcome.
Regressive Parameters
- Meaning – Larger numbers are undesirable.
- Typical examples – Defect counts, risk severity indices, response times.
- Aggregation rule – Reverse the scale before combining with other items so that bigger always equals better in the final calculation.
The reverse‑coding formula
On any bounded scale:
ð‘Ÿð‘’ð‘£ð‘’ð‘Ÿð‘ ð‘’ð‘‘_ð‘£ð‘Žð‘™ð‘¢ð‘’ = (ð‘€ð‘Žð‘¥ + ð‘€ð‘–ð‘›) – ð‘Ÿð‘Žð‘¤_ð‘£ð‘Žð‘™ð‘¢ð‘’
Example on a 0–5 range
| Raw score | Interpretation (raw) | Reversed score |
|---|---|---|
| 5 | Very high risk | 0 |
| 4 | High risk | 1 |
| 3 | Moderate risk | 2 |
| 2 | Low risk | 3 |
| 1 | Very low risk | 4 |
| 0 | No risk | 5 |
After inversion, a higher reversed score once again indicates a preferable result, aligning with progressive parameters and enabling meaningful averages or weighted sums.
Setting the type in Batoi Insight
- Open the parameter editor.
- Choose Progressive when a larger value indicates improvement.
- Choose Regressive when a larger value indicates decline. The platform will automatically handle reversals during roll-ups.
Assigning the correct label once prevents mix‑ups later and removes the need for custom spreadsheet workarounds.
Tips for reliable scoring
- Verify each scale’s wording to confirm which end is positive.
- Maintain a consistent numeric range (e.g., 0–5) across related items whenever possible; this simplifies interpretation.
- Note the parameter type in the project documentation so teammates know how each score behaves.
Selecting Progressive or Regressive correctly ensures that dashboards tell a clear story and that stakeholders can trust what they see.