Guide navigation 7 of 15
Expected result
Dive deep into your data with our advanced analysis tools. Perform cross-tabulation, correlation analysis, and trend analysis. Use interactive dashboards to visualize your data and identify key patterns and insights.
Click the Analysis menu from the primary menu section, and the Analysis page opens, as shown in Figure 1 below.
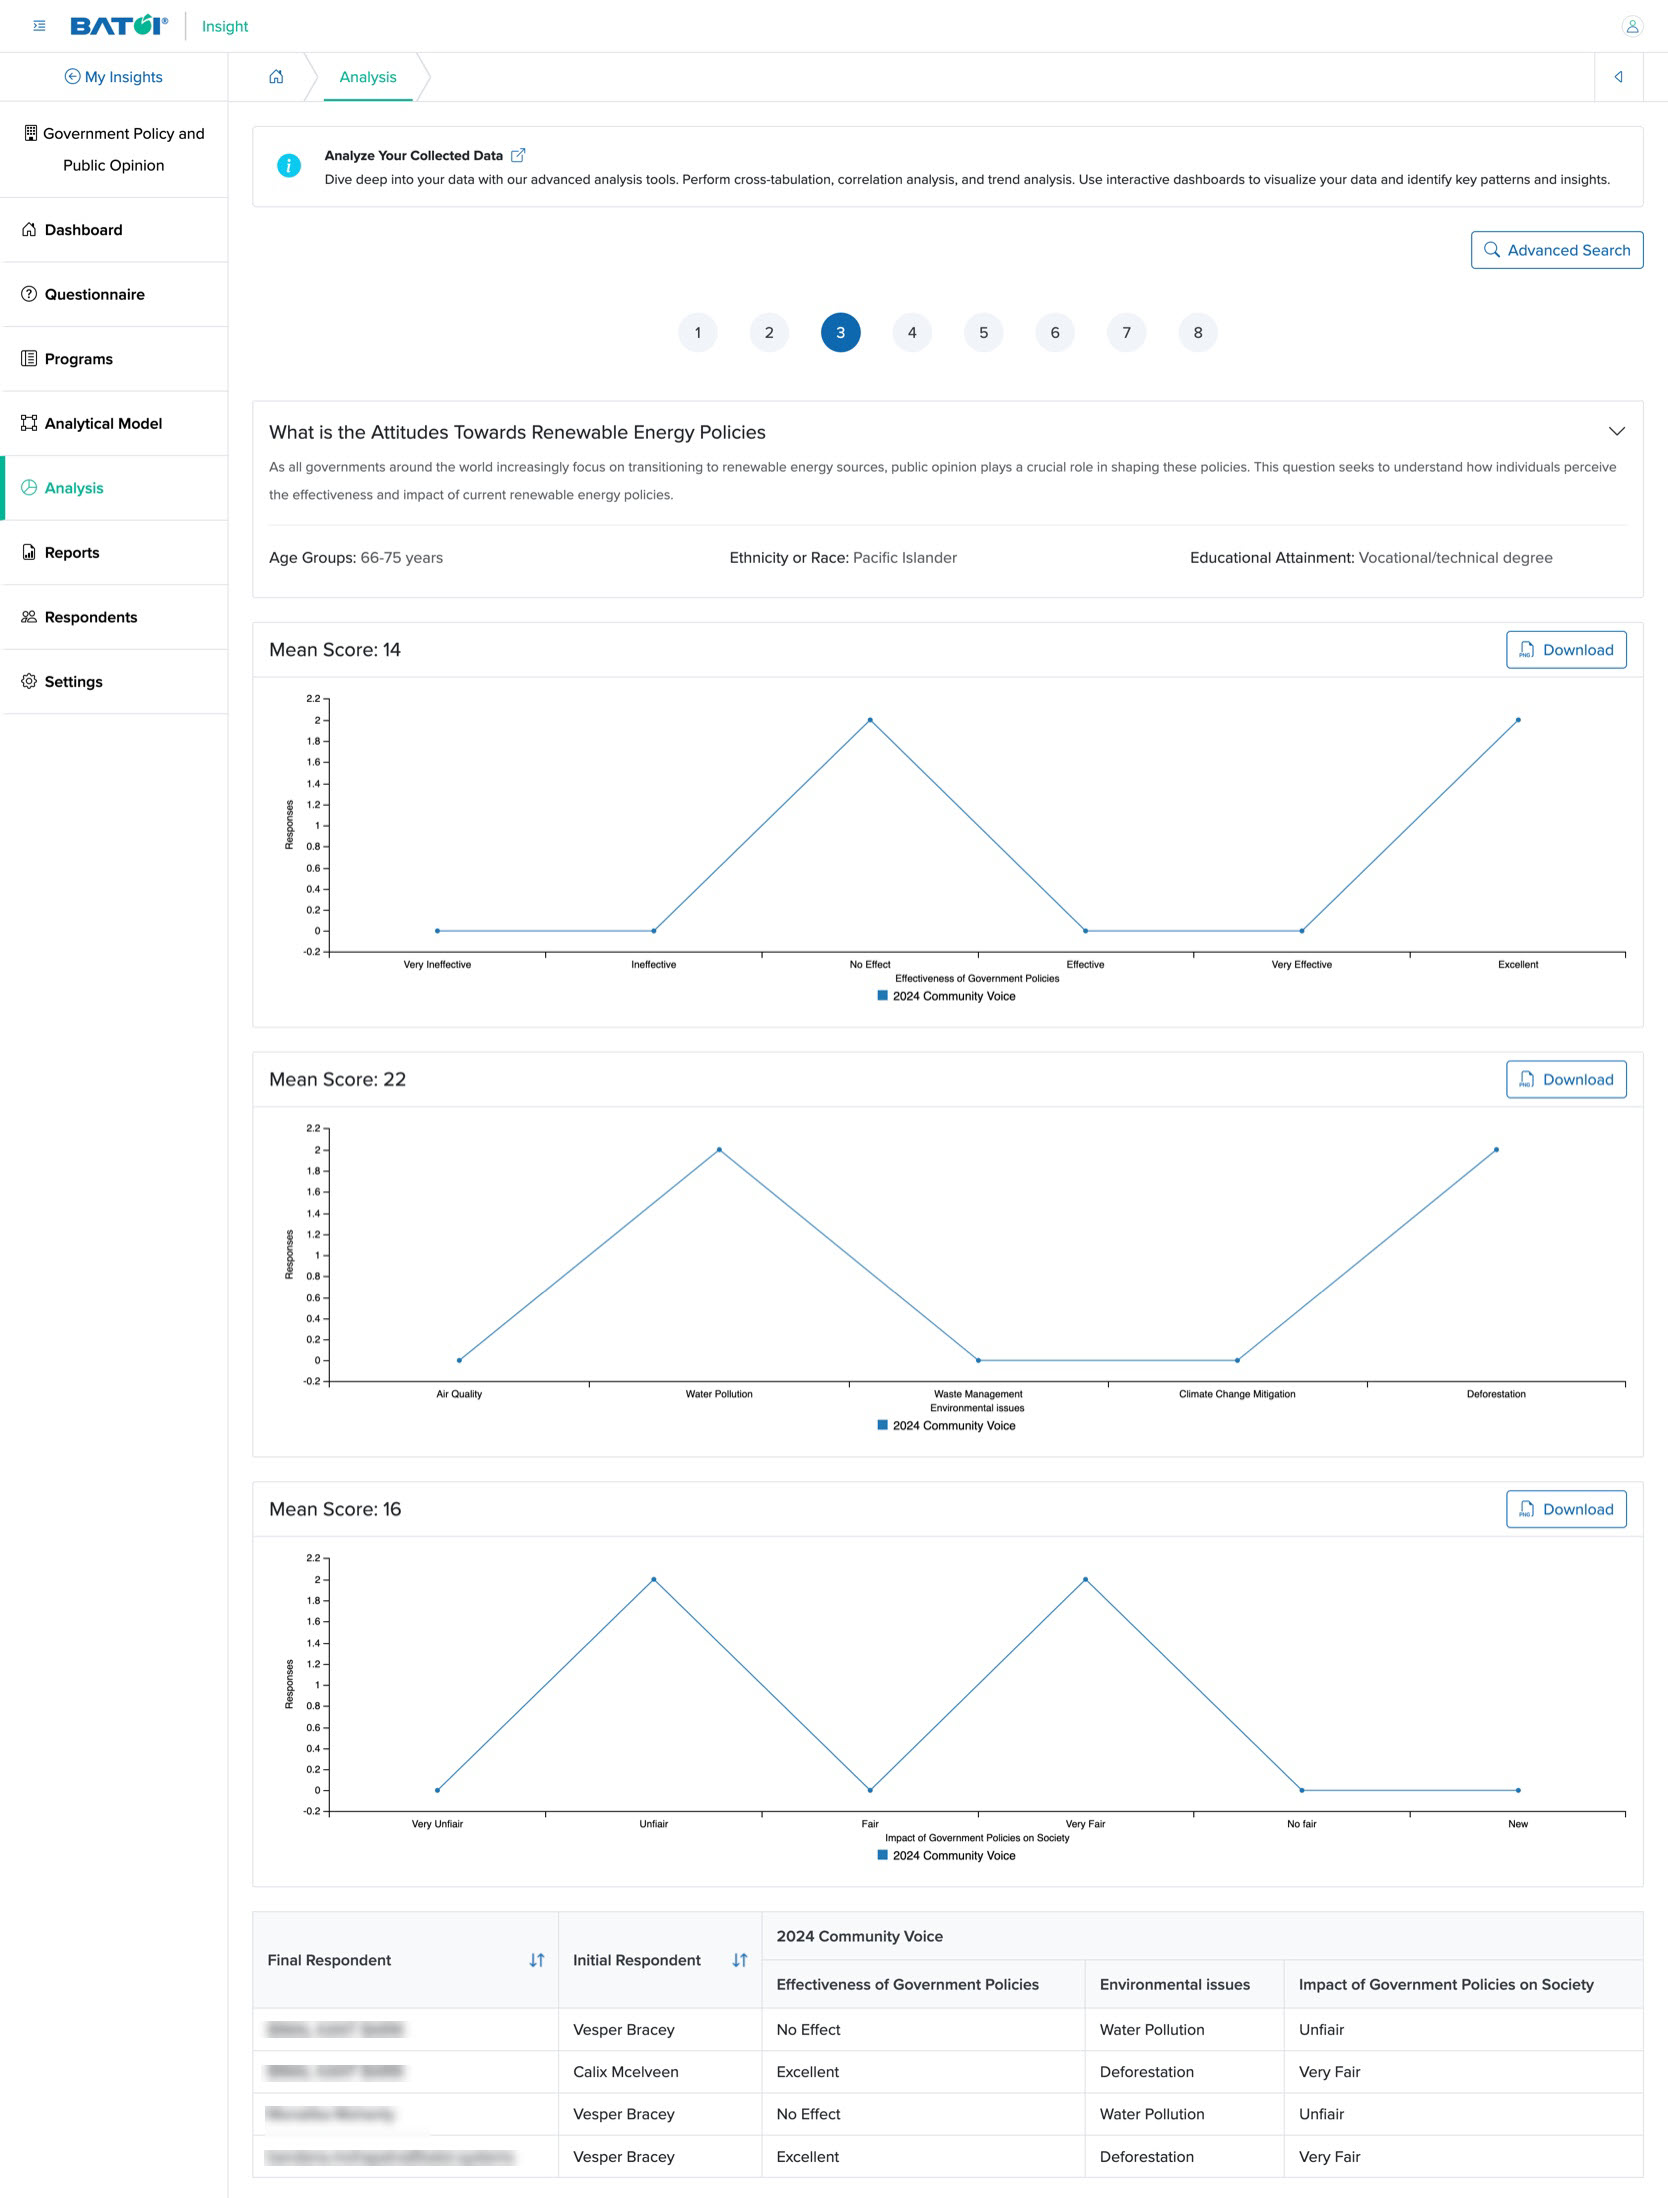
On the Analysis dashboard, you can see the score analysis of an individual question in the graph, as shown in Figure 1 above.
All the questions are listed at the top of the screen in a scrolling format, as shown in Figure 1 above.
NOTE: The questions created as ‘Single Choice’ or ‘Multiple Choice’ will have the graph.
Click the Advanced Search button on the top of the screen, and the advanced search box appears, as shown in Figure 2 below.
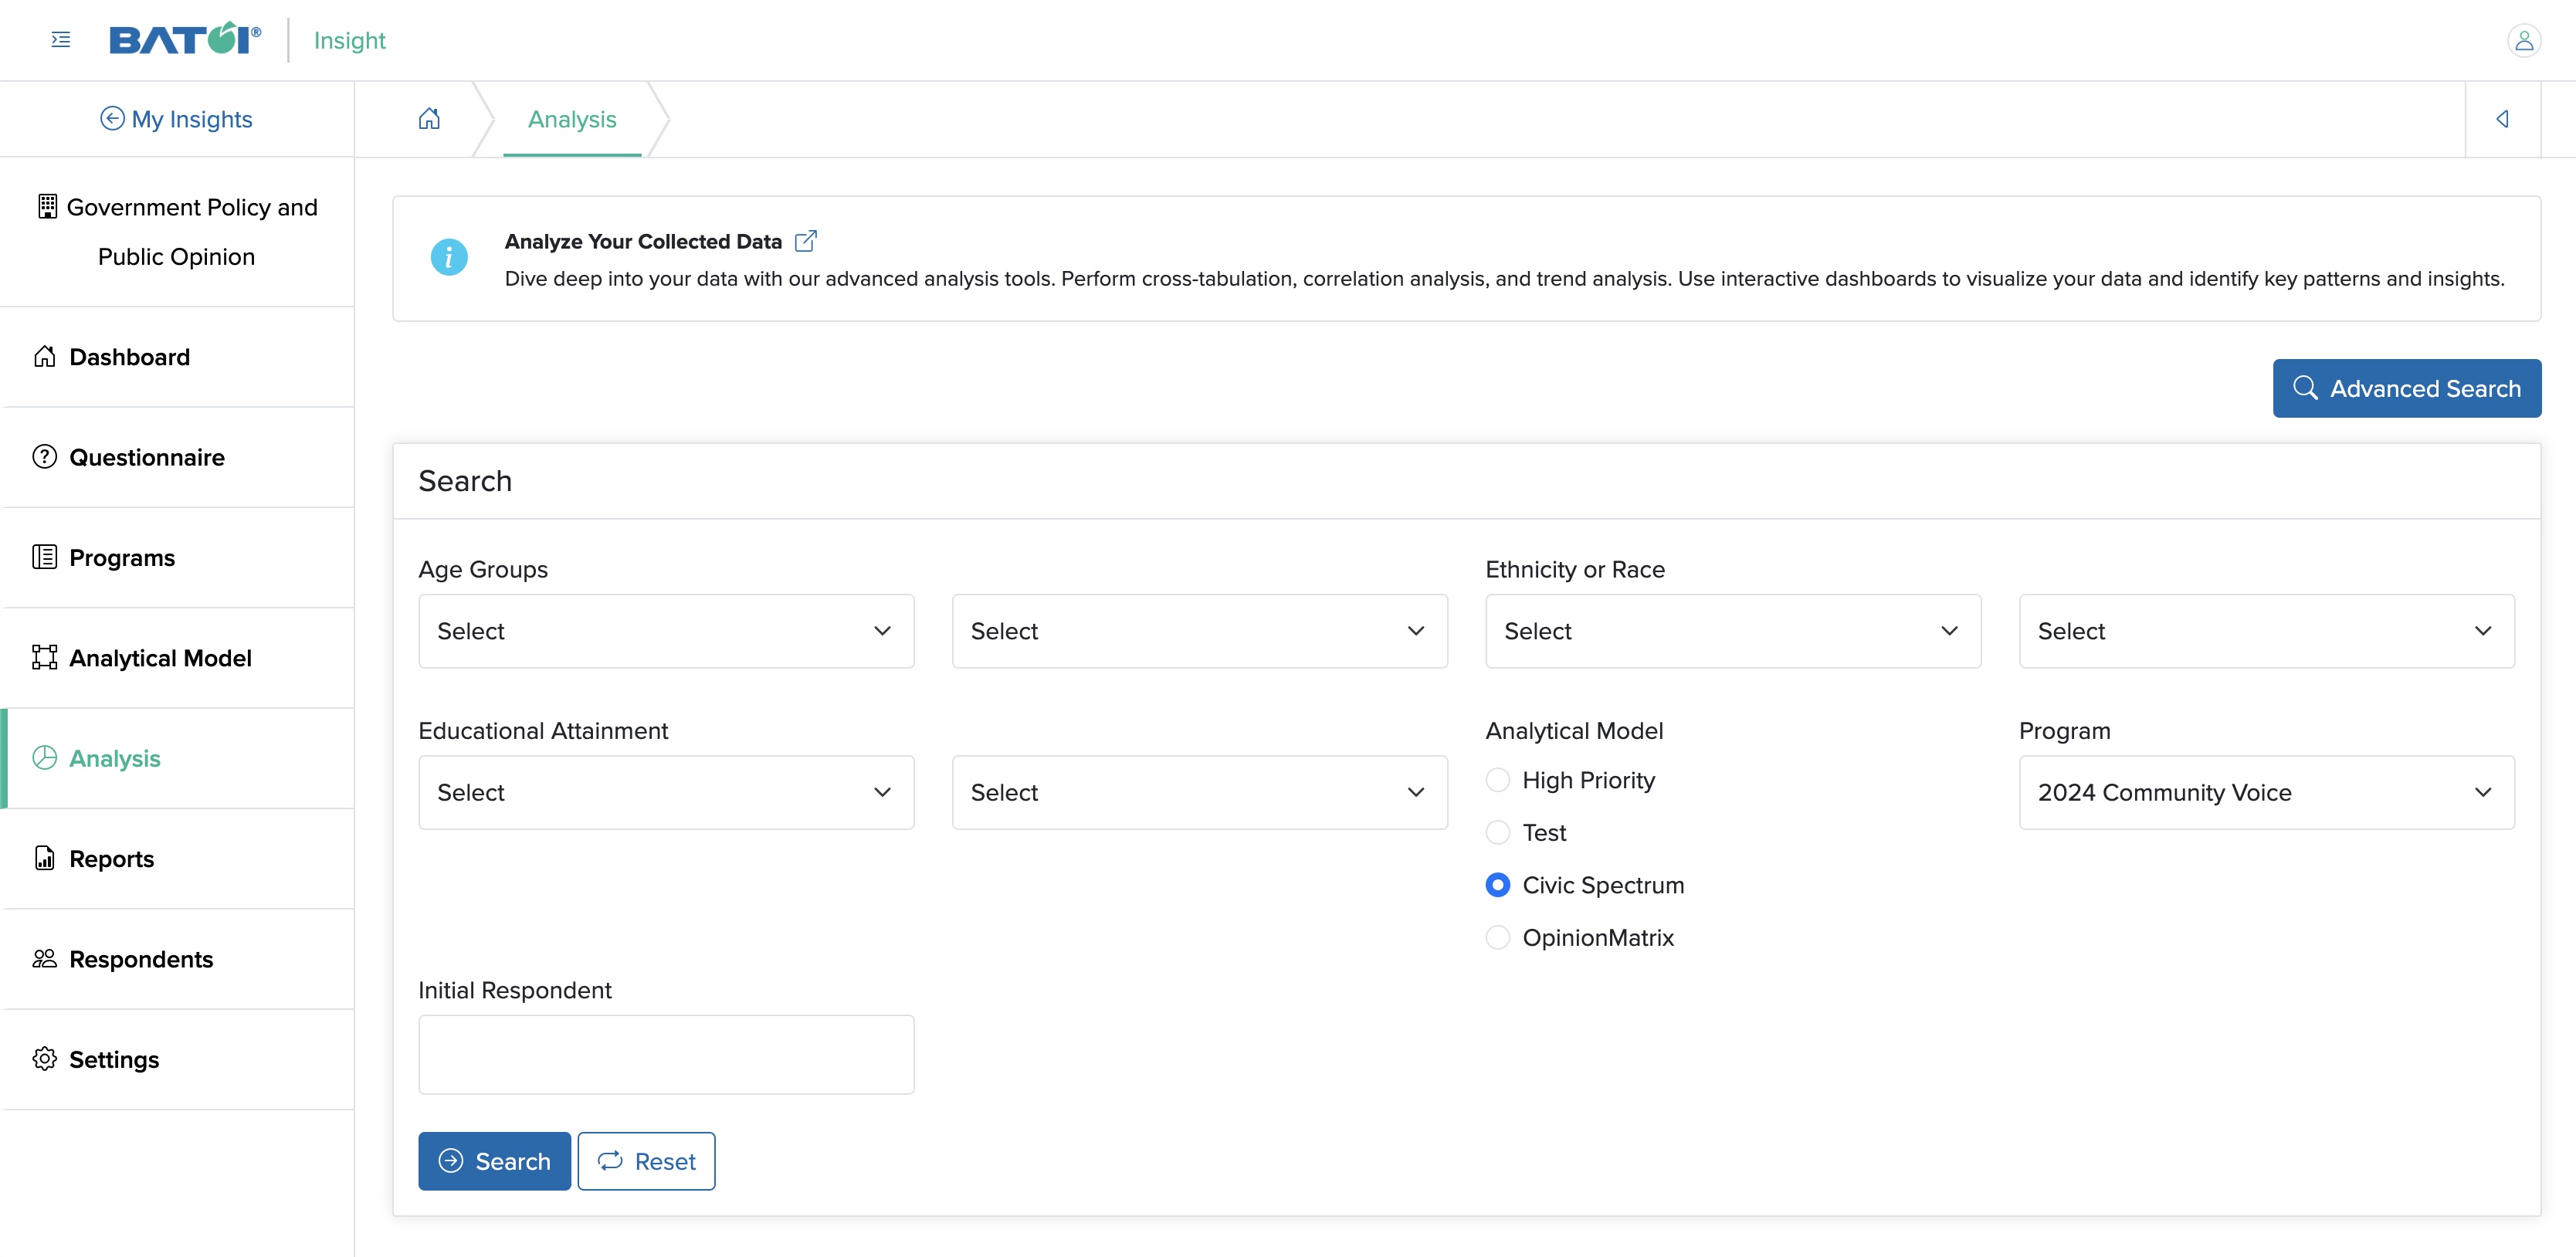
You can select a categorical parameter option from the drop-down menu in the Advanced Search, as shown in Figure 2 above.
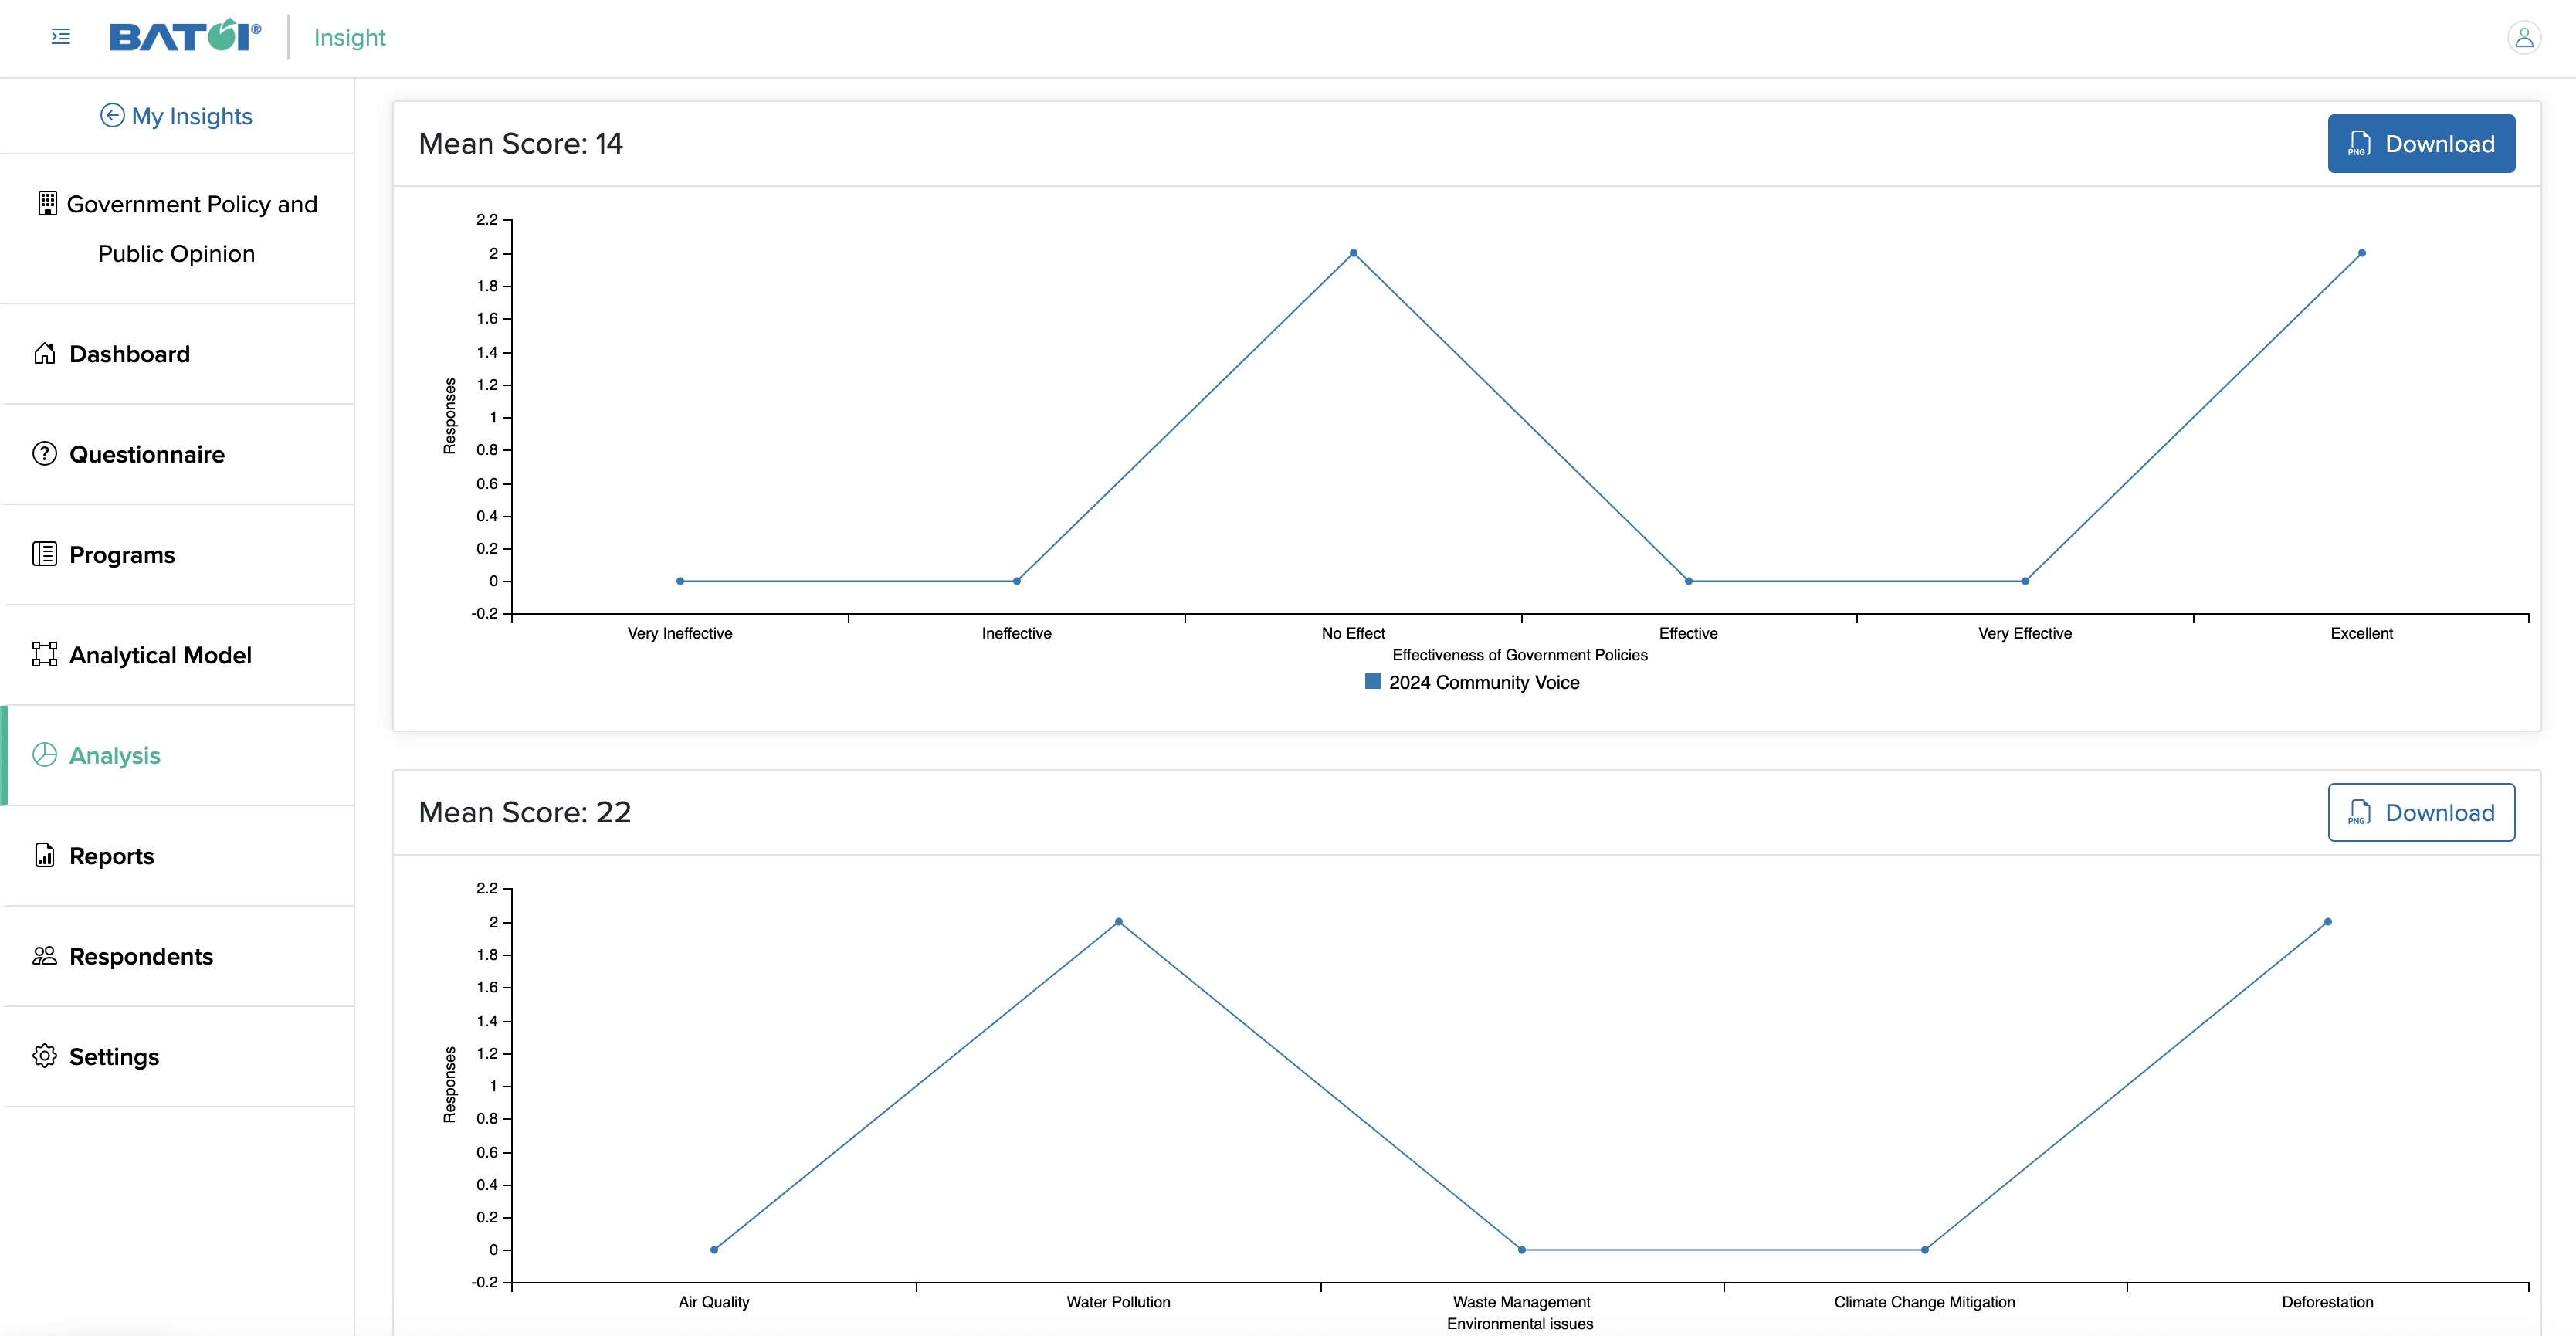
Click the Download button on the main score graph section to download the graph in image format, as shown in Figure 3 below.