
 Batoi Corporate Office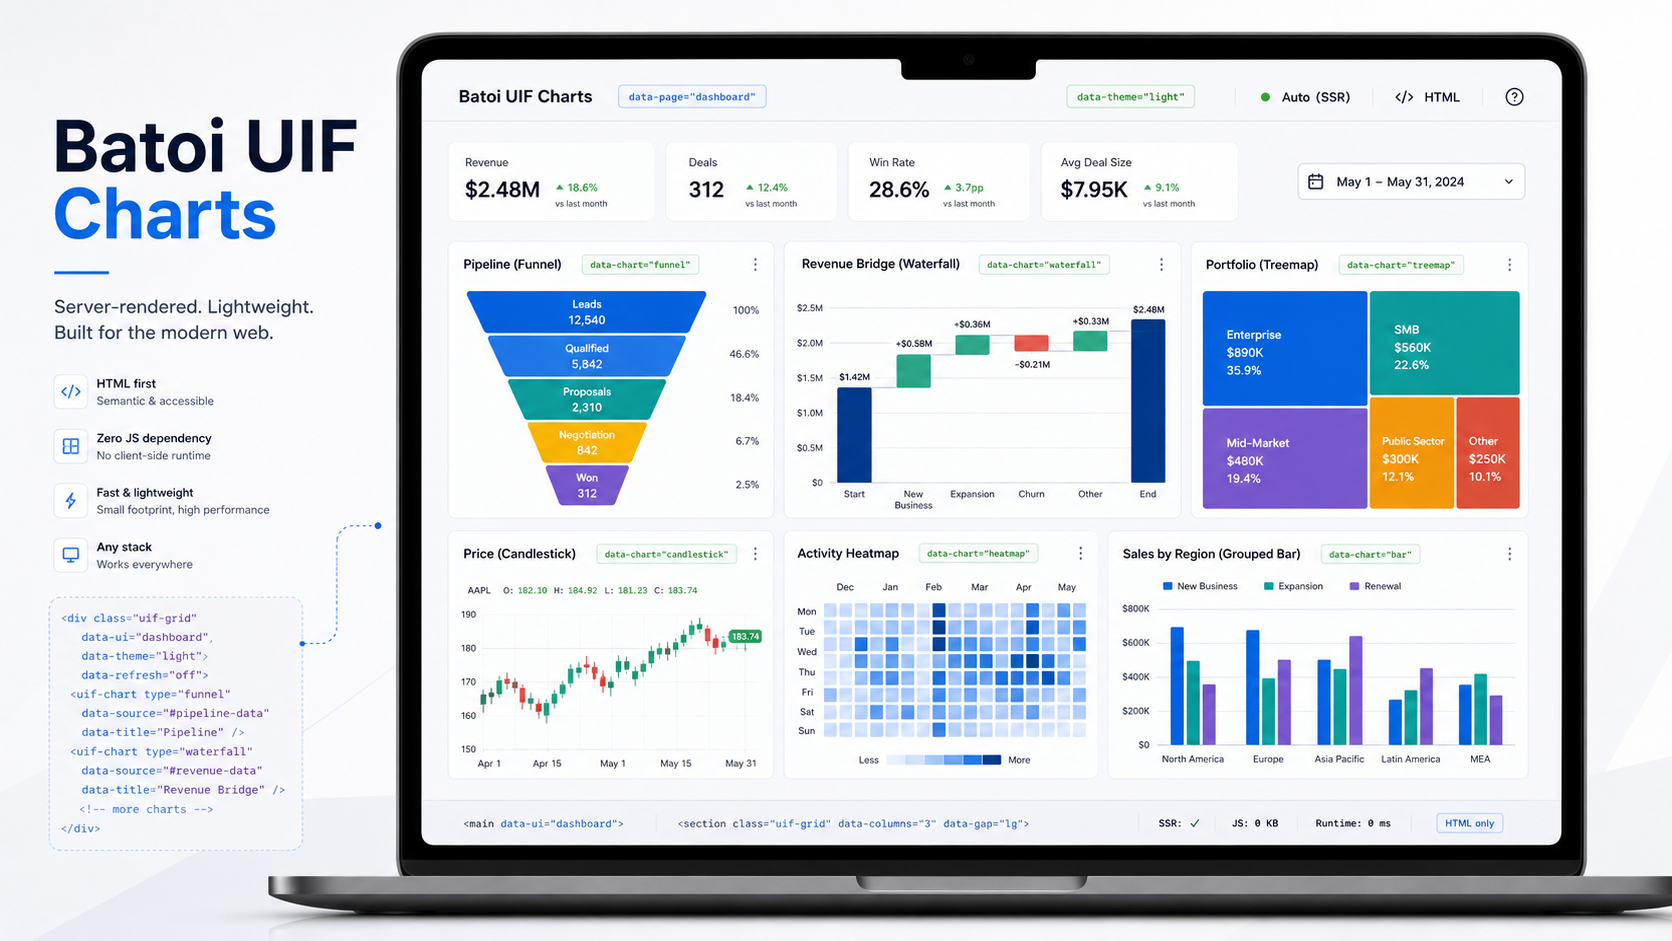
Batoi UIF has taken a significant step forward as a charting foundation for professional web application screens.
The latest chart expansion adds practical business and analytical visualizations to the existing dependency-free SVG chart engine. This matters because dashboards, admin consoles, RAD applications, approval desks, and operational systems need more than simple bars and lines. They need charts that explain conversion, movement, distribution, portfolio risk, finance periods, activity patterns, and workflow health without forcing every server-rendered app to ship a heavy frontend charting runtime.
Batoi UIF now supports a broader chart set while keeping the same core promise:
TypeScript-authored framework source, plain JavaScript and CSS distribution, zero
browser runtime dependencies, declarative data-uif-* usage, and progressive
enhancement for HTML-first applications.
Architect's note: this release includes Flint-compatible chart input support. UIF can map common Flint-style chart specifications into native UIF SVG charts, but it does not bundle Flint and does not claim complete Flint chart parity.
What Changed
The chart package now covers 35 dependency-free SVG chart types across several practical families:
- Standard dashboard charts:
line, area, bar, horizontal-bar, grouped-bar, stacked-bar, pie, donut, doughnut, radar,andsparkline - Compact app charts:
metric, progress, ring, gauge, timeline, heatmap, status-heatmap,andbullet - Statistical charts:
histogram, box-plot, scatter, regression, control-chart, distribution,andpareto - Business workflow charts:
funnel, waterfall, bubble, treemap,andcalendar-heatmap - Finance and cyclical charts:
candlestick, ohlc, rose,andpolar-area
Each new chart type is designed for real application use cases. A sales team can use
funnel for pipeline conversion. A finance screen can use waterfall for a revenue
bridge. An operations team can use calendar-heatmap for daily activity intensity. A
portfolio view can use bubble for risk, revenue, and account size. A market
dashboard can use candlestick or ohlc without loading an external charting
library.
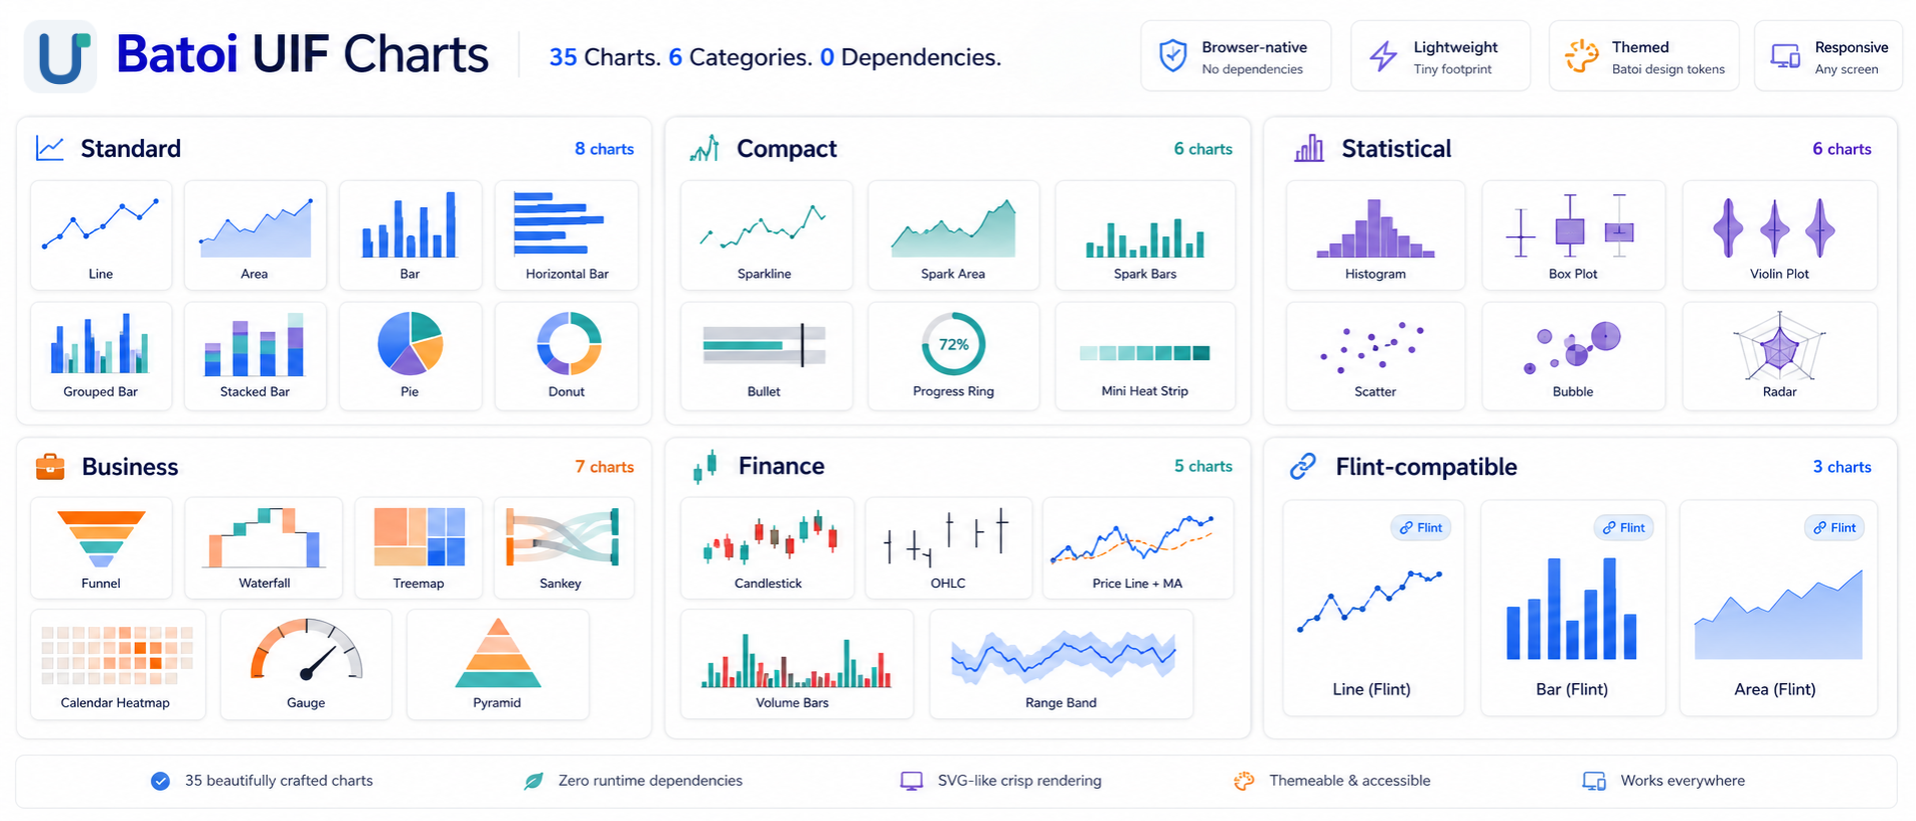
Batoi UIF now supports 35 dependency-free SVG chart types for practical business dashboards.
Why This Matters
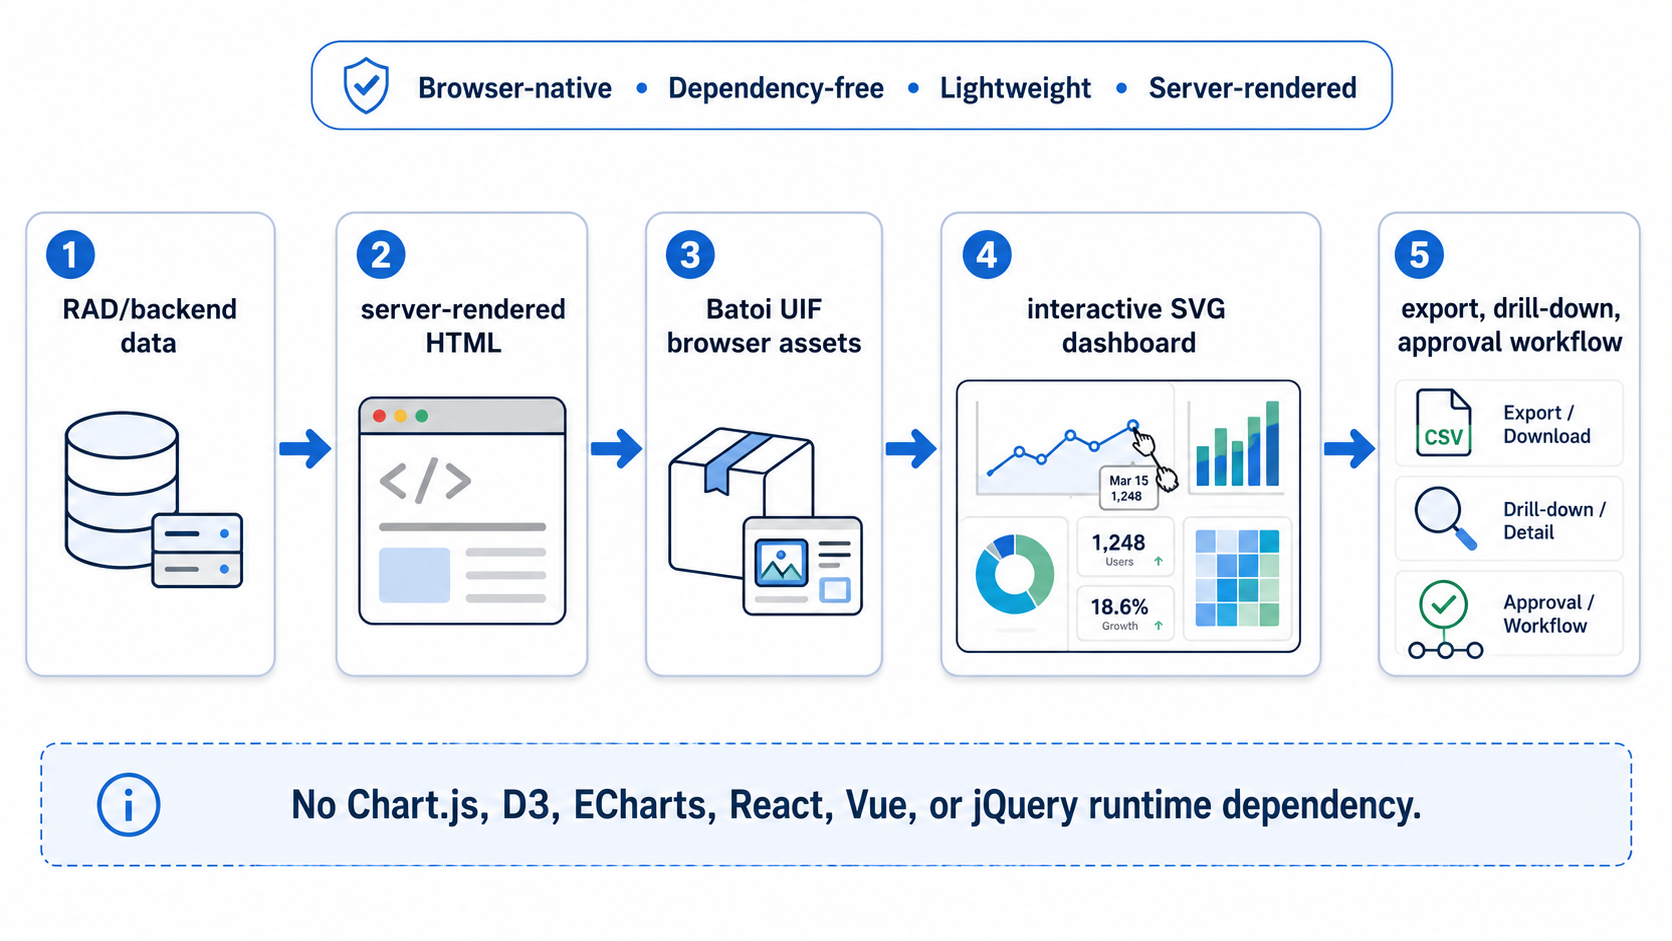
Many business applications still rely on server-rendered pages, RAD systems, PHP applications, admin panels, and internal tools. These systems often need modern visual interfaces, but they do not always need a full SPA framework or a large charting dependency.
Batoi UIF is built for this space.
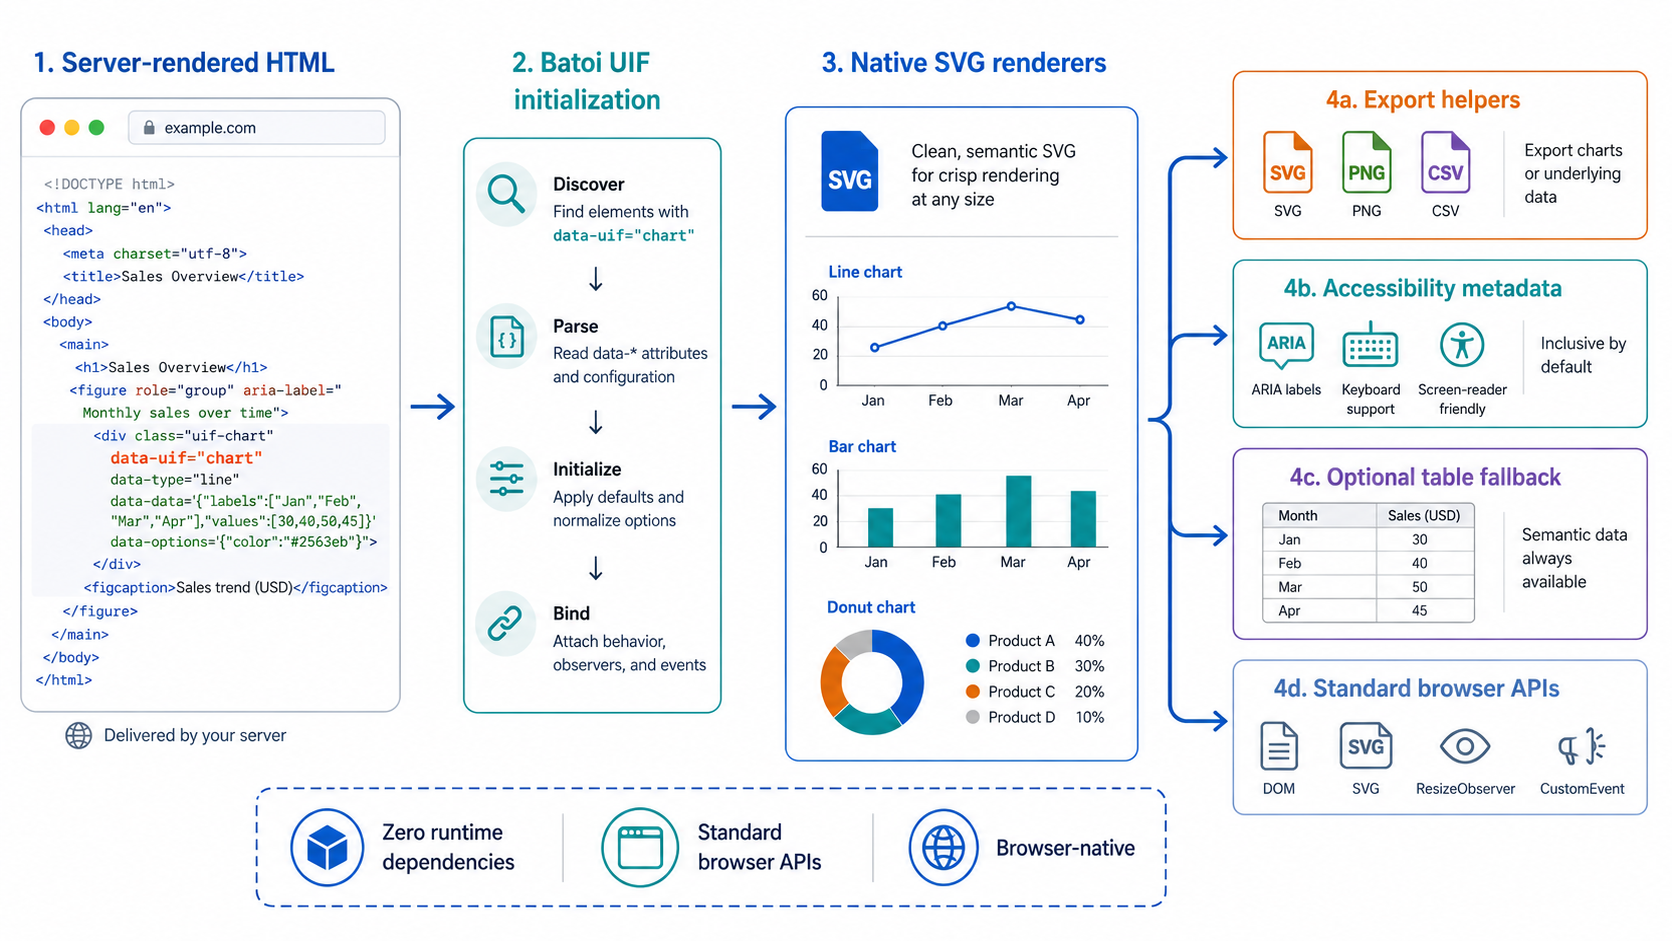
The chart expansion keeps charts close to the application markup. A chart can still be declared directly in HTML:
<div data-uif="chart" data-uif-chart="waterfall" data-uif-options="{"grid":true,"focusable":true}"
data-uif-data="[
{"label":"Start","value":1000,"role":"start"},
{"label":"Expansion","value":240},
{"label":"Churn","value":-90},
{"label":"End","value":1150,"role":"end"}
]"> </div>
This is the intended Batoi UIF pattern: meaningful HTML first, browser-native enhancement second.
Flint-Compatible, Not Flint-Complete
This update also introduces a clearer compatibility boundary for Flint-style chart specifications.
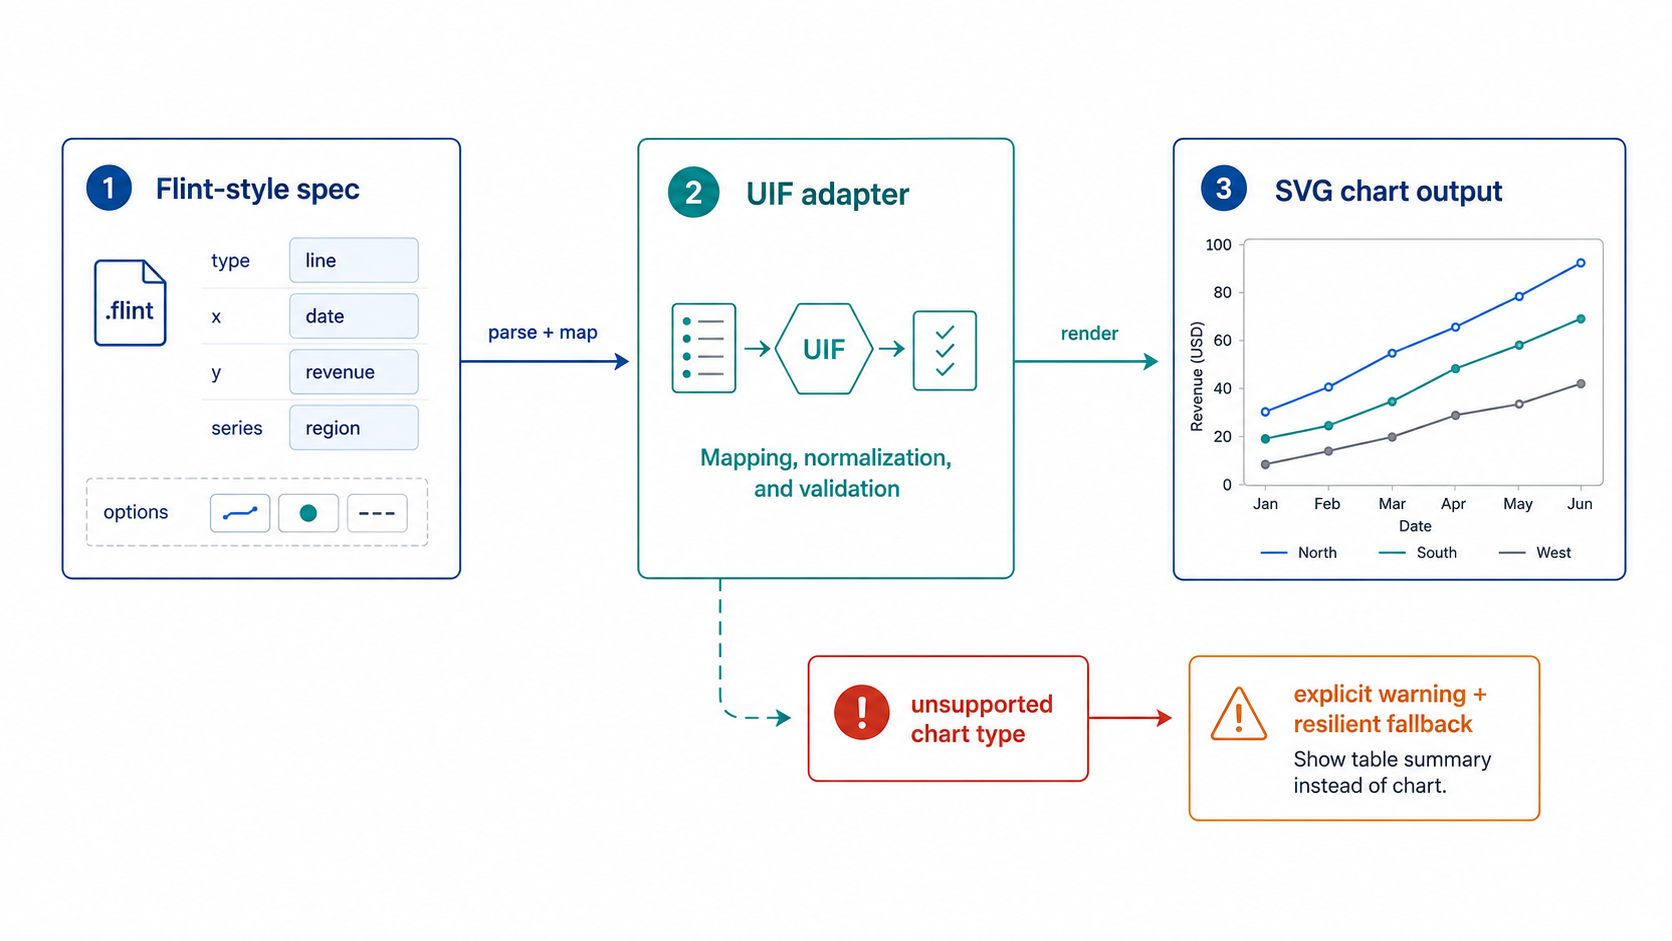
Batoi UIF can accept a Flint-compatible input shape through
data-uif-chart-format="flint", adaptFlintChart(), and
renderFlintChart(). Common Flint chart names and encodings are mapped into
native UIF chart renderers. This gives Batoi RAD and AI-assisted workflows a practical
bridge from generated chart intent into dependency-free browser output.
For example:
<div data-uif="chart" data-uif-chart-format="flint"
data-uif-data='[
{"quarter":"Q1","segment":"New","revenue":120},
{"quarter":"Q1","segment":"Renewal","revenue":88},
{"quarter":"Q2","segment":"New","revenue":148},
{"quarter":"Q2","segment":"Renewal","revenue":112}
]'
data-uif-chart-spec='{
"chartType":"Grouped Bar Chart",
"title":"Revenue by Segment",
"encodings":{
"x":{"field":"quarter"},
"y":{"field":"revenue"},
"color":{"field":"segment"}
}
}'
> </div>
The important architectural point is restraint. UIF is Flint-compatible for common dashboard charts, but it is not trying to become Flint or replicate every advanced chart family inside core.
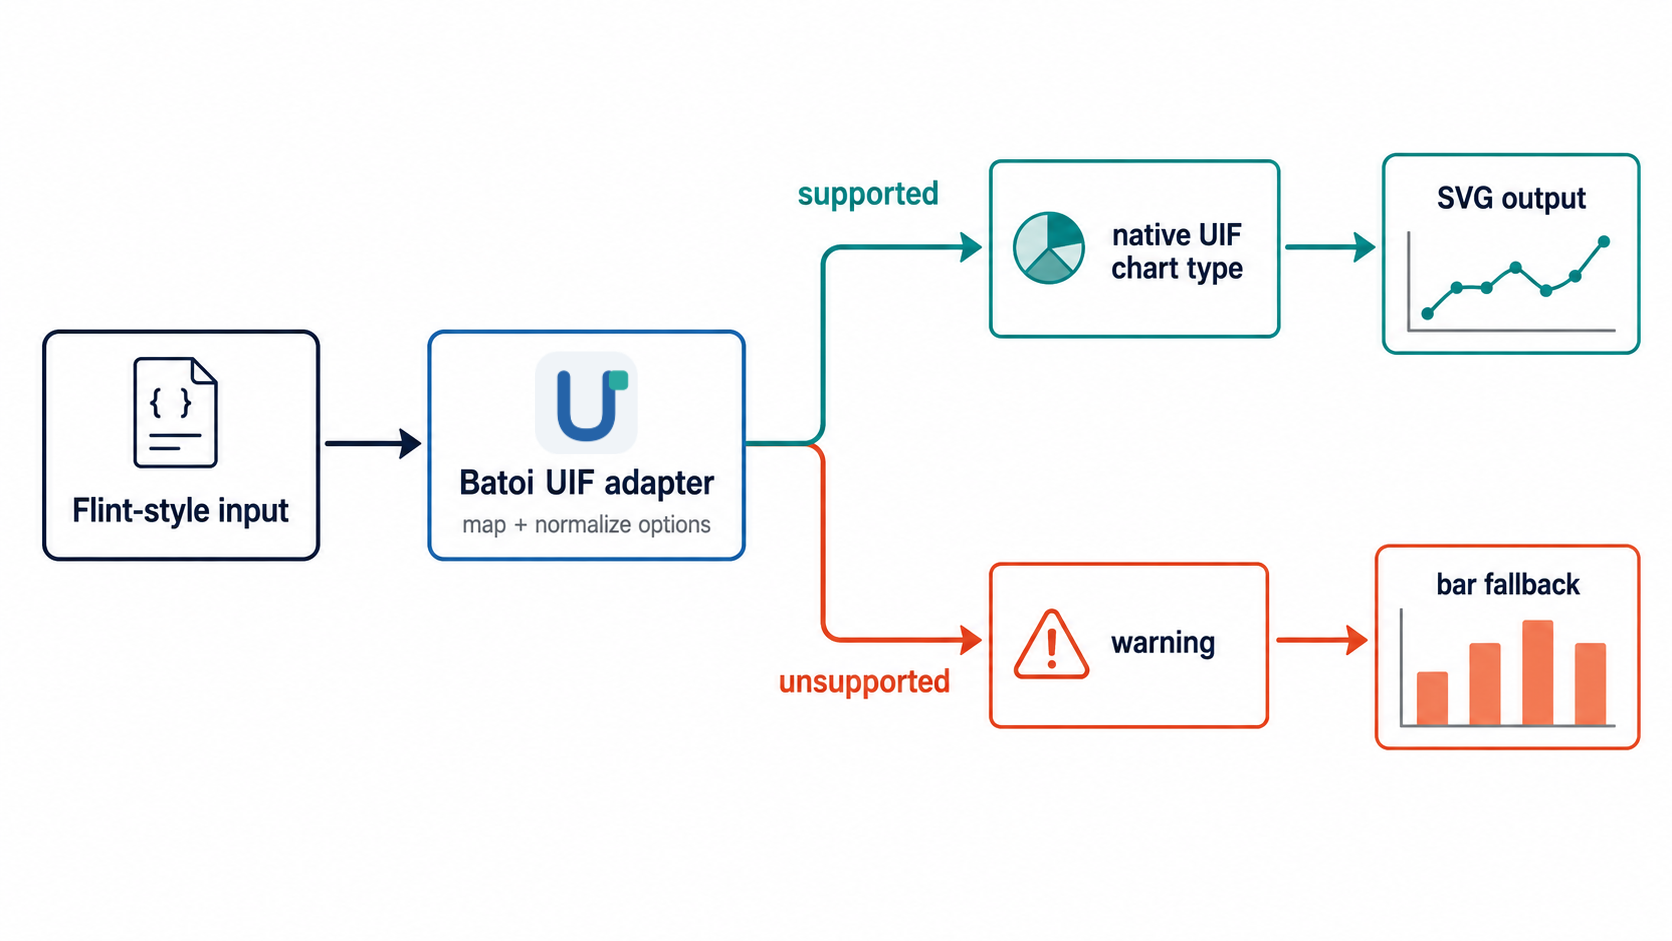
Unsupported Flint chart types now emit explicit warnings instead of silently
pretending that everything is supported. Pages remain resilient with a simple fallback,
while developers can still inspect capability gaps through
FlintChartAdapterResult.warnings and declarative hydration metadata.
In practical terms:
- Supported Flint-style inputs map to native UIF chart types such as bar, line, area, grouped bar, stacked bar, pie, donut, radar, scatter, heatmap, histogram, funnel, waterfall, bubble, treemap, calendar heatmap, candlestick, OHLC, rose, and polar area.
- Unsupported Flint chart names stay explicit through warnings and fallback behavior.
- Advanced visual families such as Sankey, alluvial, sunburst, network, and Gantt remain out of chart core until they have a dedicated product workflow and layout strategy.
- The integration is a compatibility bridge for RAD and AI-assisted chart generation, not a runtime dependency on Flint.
What We Deliberately Deferred
The update also makes a clear call on advanced chart families:
SankeyandAlluvialare deferred to an optional advanced/server-side rendering track.Sunburstis deferred until hierarchy-chart demand exceeds whattreemapcovers.Networkbelongs to a separate graph/layout capability, not chart core.Ganttbelongs to a future planning/timeline component with scheduling and editing behavior.
This is a product architecture decision, not a missing feature list. These chart families require layout engines, collision handling, routing, interaction models, and sometimes scrolling or editing behavior. Adding them directly to core would weaken the zero-dependency promise and make the base chart package harder to maintain.
For Batoi UIF, the better path is to keep the core chart package focused on high-value dashboard visuals and leave graph-heavy or planning-heavy experiences to dedicated packages or server-side rendering.
Better Examples and Compatibility Docs
The chart gallery has also been expanded. It now includes:
- one declarative example for every supported chart type
- copy-ready chart markup, data, and options
- SVG and PNG export controls
- Flint-compatible examples
- a visible Advanced section explaining deferred chart families
The new chart compatibility documentation records native chart support, Flint aliases, unsupported behavior, QA expectations, and release checks. This gives developers and product teams a realistic view of what UIF charts support today and where the boundaries are.
Accessibility and App-Focused Behavior
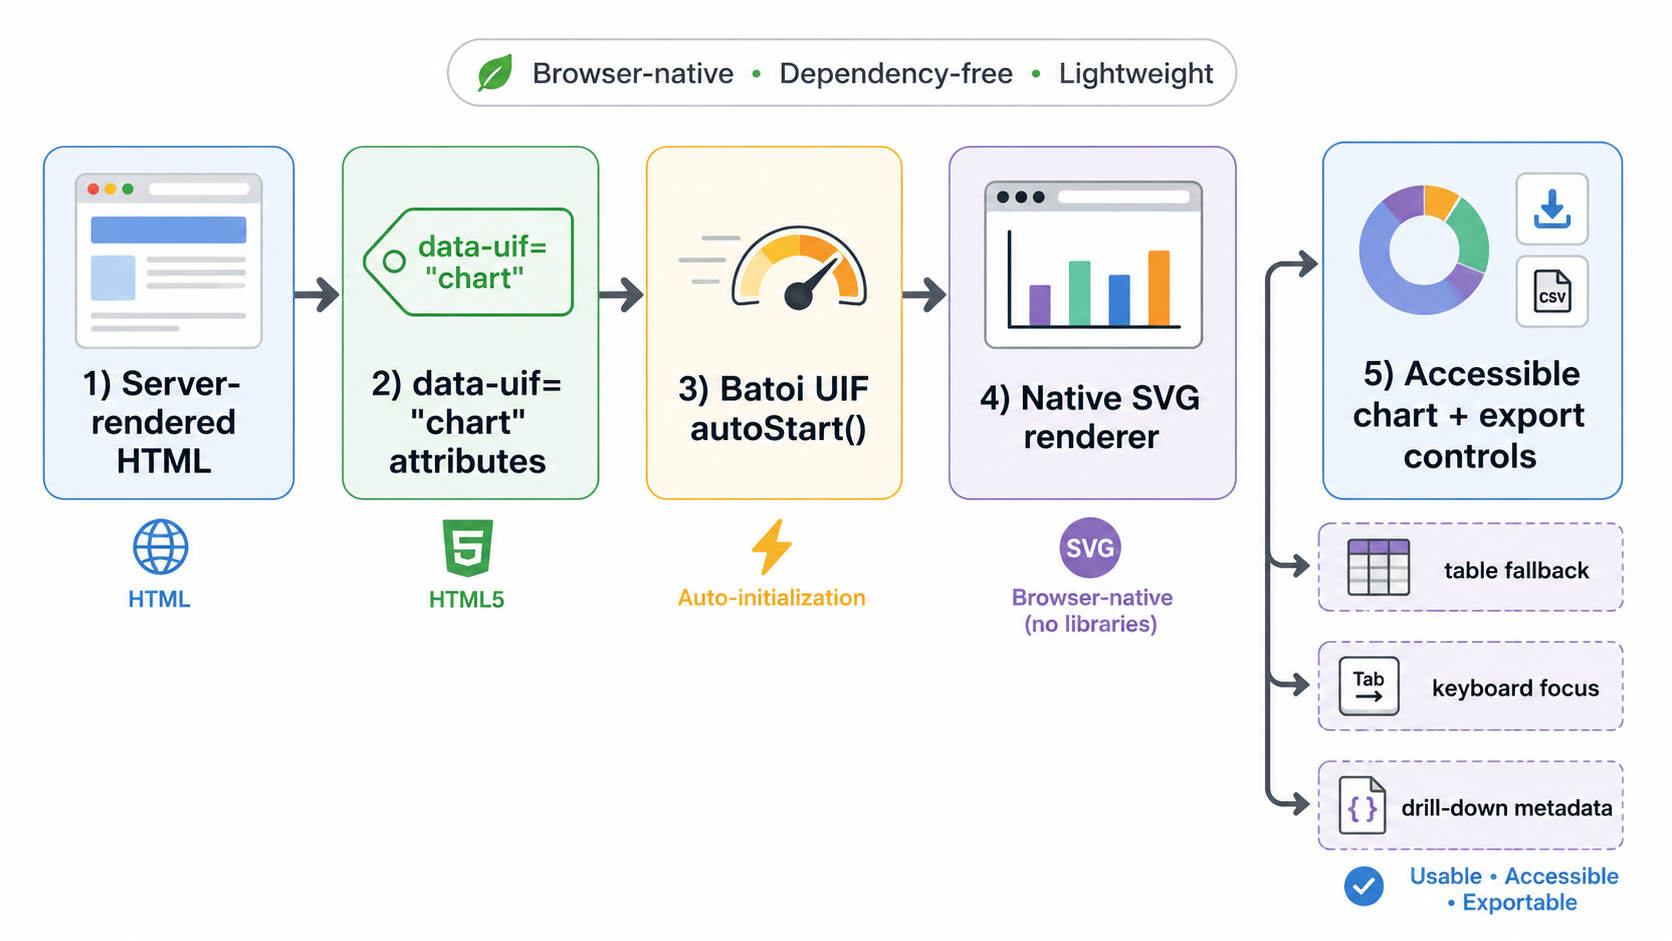
The chart system remains SVG-first and app-focused. Chart output supports SVG title and description text, optional table fallback, keyboard focus for interactive marks, drill-down metadata, and export helpers.
The goal is not decorative reporting. The goal is dependable dashboard UI for business software.
That means charts should work in:
- server-rendered RAD pages
- admin consoles
- dashboards
- approval workflows
- mobile shells
- Micro Apps
- AI/MCP review surfaces
- operational monitoring screens
Technical Summary
This update includes:
- new native chart types for business, finance, cyclical, and activity dashboards
- Flint-compatible chart input mapping
- explicit unsupported Flint chart warnings
- expanded tests for chart rendering and adapter behavior
- chart gallery coverage for every supported chart type
- chart compatibility documentation
- QA and release checklists
- an internal Flint adapter module split to keep chart internals maintainable
- regenerated package and browser distribution output
The focused verification path is:
npx vitest run packages/charts/src/index.test.ts
npm --workspace @batoi/uif-charts run build
npm run build:dist
git diff --check
Closing
Batoi UIF charts are now broad enough for serious application dashboards while remaining aligned with the framework’s core philosophy: browser-native, dependency-free, server-rendering-friendly, declarative, and practical.
This is the direction for Batoi UIF as a whole. Add the capabilities that real business applications need, but keep the runtime lean and the architecture understandable.