 Batoi Corporate Office
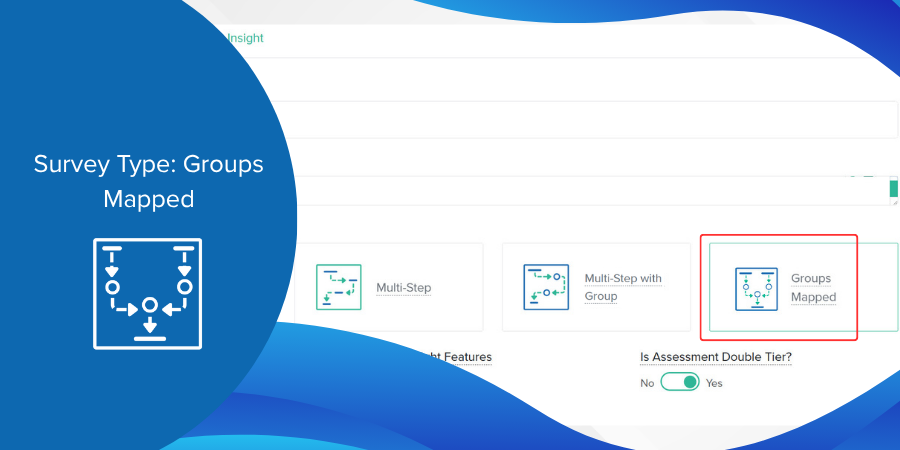
A More Connected Way to Organize Questions
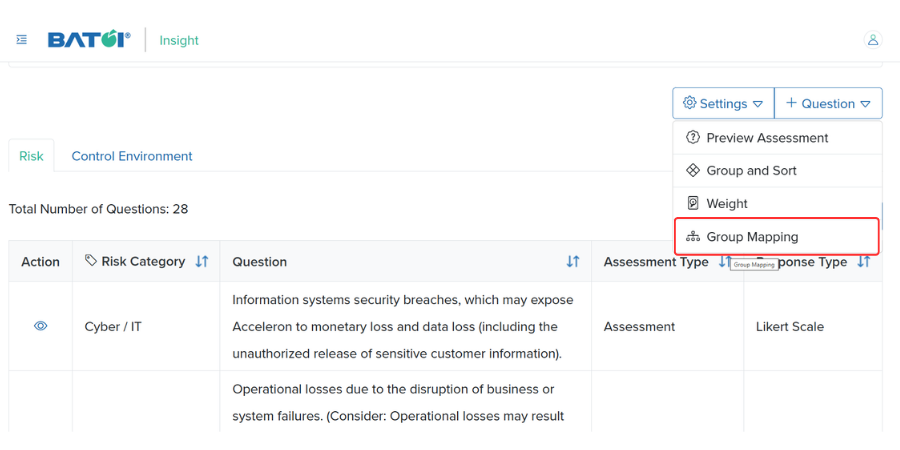
When creating a survey under the new type, you’ll now find a Group Mapping option in the settings menu of the Questionnaire page. Selecting it takes you to a visual mapping view, where all groups appear in columns. The first group is treated as the primary group, and each of its questions can be linked to one or more questions from the other groups.
This layout makes it easy to see — at a glance — how your questions connect across different groups.
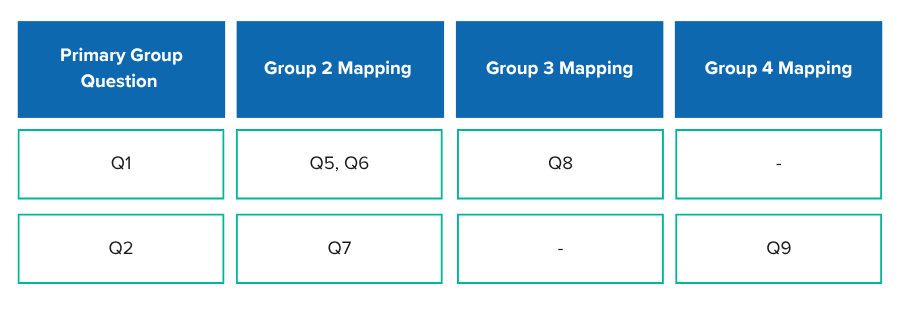
The result is a clearer, more structured mapping process that ensures relationships between questions are never lost in the shuffle.
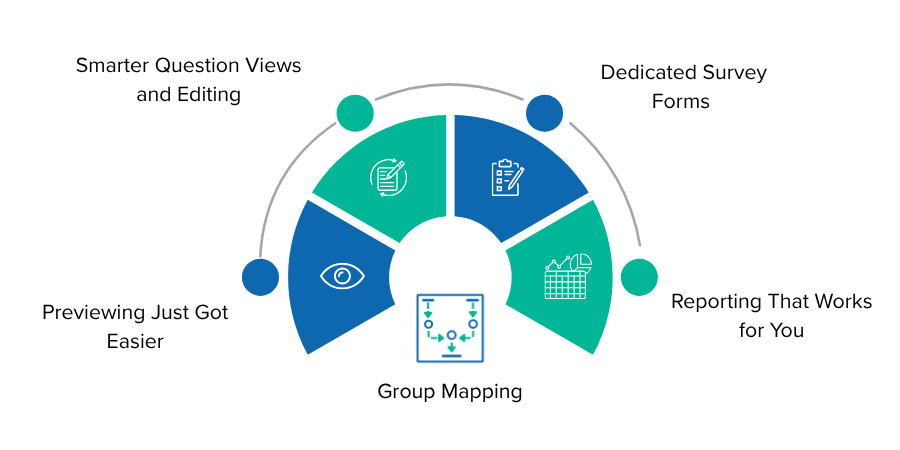
Smarter Question Views and Editing
When you open a question that is linked to others, a Group Mapping table now appears directly on the View Question page, complete with an Edit button for quick updates.
For surveys using a Likert Scale response type, the View Question page also displays score parameters alongside their options. These options appear as disabled radio buttons — a subtle but effective way to show the scoring structure without risking accidental edits.
In addition, the term “Mapping” has been updated to Tier Mapping on Add/Edit Pre-Assessment pages, aligning terminology with the new multi-tier approach.
Previewing Just Got Easier
To make large, group-based surveys less overwhelming, Batoi Insight now offers a dedicated preview page for the “Groups Mapped” survey type.
Here’s what’s different:
- Only questions from the primary group are shown.
- The preview focuses exclusively on Likert Scale response types.
- Everything is presented in a clean tabular format for faster scanning.
If your survey is set up as two-tier, all pre-assessment questions appear in preview and the live survey without additional steps, keeping the experience smooth for respondents.
Dedicated Survey Forms
To complement the improved previews, the “Groups Mapped” survey type also comes with its own survey form format. This form shows only Likert Scale questions in a table, making it ideal for comparative scoring and reducing clutter for participants.
Reporting That Works for You
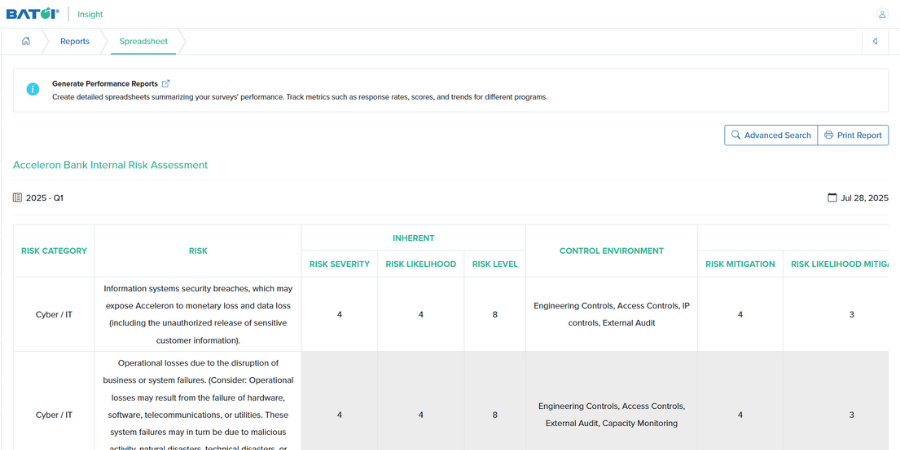
On the reporting side, the familiar Performance Spreadsheet has been renamed simply Spreadsheet for “Groups Mapped” surveys. The updated layout makes it easier to read and interpret your data, with a structure that better matches the mapping logic.
For analysts who want more control, the Add/Edit Analytical Model pages now include a “Don’t Apply Normalization” option, letting you skip normalization when it’s not needed for your scoring model.
Why This Update Matters
The new “Groups Mapped” survey type is a significant step forward for anyone running complex assessments, from benchmarking exercises and skills audits to standardized evaluations across multiple teams. By combining visual mapping, tabular previews, and more flexible reporting, Batoi Insight is making it easier than ever to run surveys that are both structured and insightful.
If you’re ready to try it out, log in to Batoi Insight and create your first “Groups Mapped” survey today. Your assessment process is about to get a whole lot smarter.