 Batoi Corporate Office
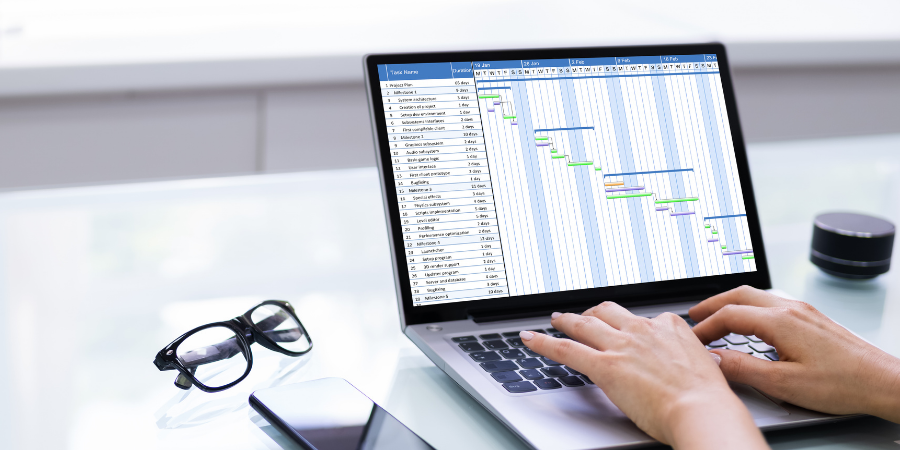
The Gantt chart was the first formal technique created for managing projects, and it's still going strong today. Gantt charts help you keep track of your project tasks by displaying information visually.
Projects often have a large number of activities you need to keep track of, and if you finish a task out of sequence or miss a deadline, it can have knock-on effects for the rest of the project. Suddenly, you have a project that's out of control and a very stressed project manager who's drowning in tasks. Gantt charts are designed to combat this situation and keep you on track by allowing you to see the whole project at a glance.
How Does a Gantt Chart Work?
Put simply, a Gantt chart is a bar chart that offers a visual view of all project tasks scheduled over time, as well as the dependency relationships between tasks and the schedule status. Typically, a Gantt chart is split into two sections. You have a list of project items on the left, and on the right, you have a timeline with schedule bars to highlight work.
A Gantt chart can also include other critical project data like milestones, tasks' start and end date, and assignees.
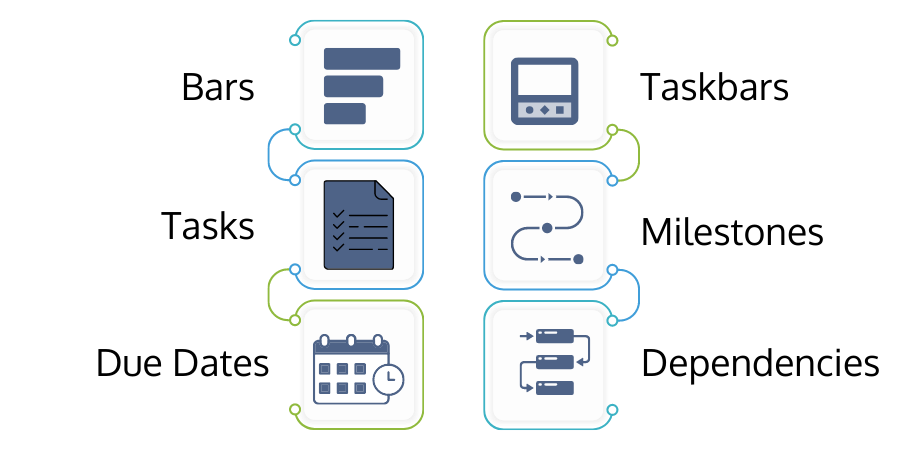
Let's take a look at some of the features of a Gantt chart in closer detail:
- Due Dates - Dates outline when the project should start and end, as well as when each job should be completed.
- Tasks - Projects typically have many sub-tasks and these can be displayed on the left of the page.
- Bars - Bars represent the timeframe in which you should perform each task. If you complete the subtasks on time, the project will finish on time.
- Taskbars - Taskbars can be used to highlight what portion of a task has been completed. In some cases, you might be able to complete a task very quickly, so you won't need a taskbar. However, some larger jobs might take longer, and seeing progress at a glance is valuable. You can also show % complete.
- Milestones - These are tasks that are critical to the project's success. Completing milestones is a good indication of how the project is progressing.
- Dependencies - Some tasks are dependent on the success of other tasks. For example, you can't test code that hasn't been written yet. These items are linked through arrows on a Gantt chart, indicating the relationship between two or more tasks.
You can create Gantt charts using Microsoft Excel, but many companies opt for dedicated Gantt chart software today. Gantt software (or project management platforms that include Gantt charts) typically offers aesthetically pleasing charts with tons of automation and many additional features.
When Should You Use a Gantt Chart?
Some people choose to display their project using a simple project timeline, and others prefer a Gantt chart, but how do you determine which one is the best for your project? If you have a large project with lots of tasks, a Gantt chart will always be the best option. However, that's not to say Gantt charts aren't suited to smaller or individual projects. Gantt charts help ensure that you complete your project tasks efficiently and effectively by visually showing how they fit into your project timeline.
But are there any situations where it might make more sense to use a simple project timeline instead? Sure. If you just want to show someone the high-level overview of activities involved in your project without any extra detail, a project timeline might be a better fit.
Additionally, if your project has no fixed duration, you might not find value in using a Gantt chart, although very few projects fit this description.
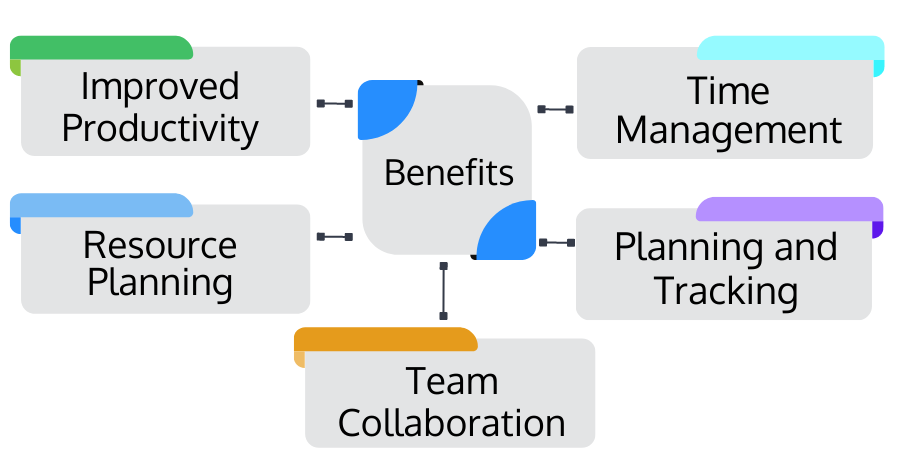
Benefits of Using a Gantt Chart
- Improved Productivity - Gantt charts provide all project leaders and stakeholders with live information about the project’s progress. With a Gantt chart, the team knows what's coming next and can start preparing.
- Resource Planning - Gantt charts make it easy to assign tasks to resources, spot resource availability issues, and keep track of performance.
- Team Collaboration - Gantt charts provide a one-page overview of the project that the whole team can use. This means project managers don't need to waste time briefing team members on the project's progress.
- Planning and Tracking - Since Gannt charts show all tasks, dependencies, time frames, and milestones, they make planning and tracking projects much more straightforward.
- Time Management - The time-based nature of Gantt charts helps ensure that projects don't slip. Often, project managers over-assign tasks to one employee or don't have a clear idea of how long a task will take. Gantt charts help you see where you're slipping before it impacts the project end date.