 Batoi Support
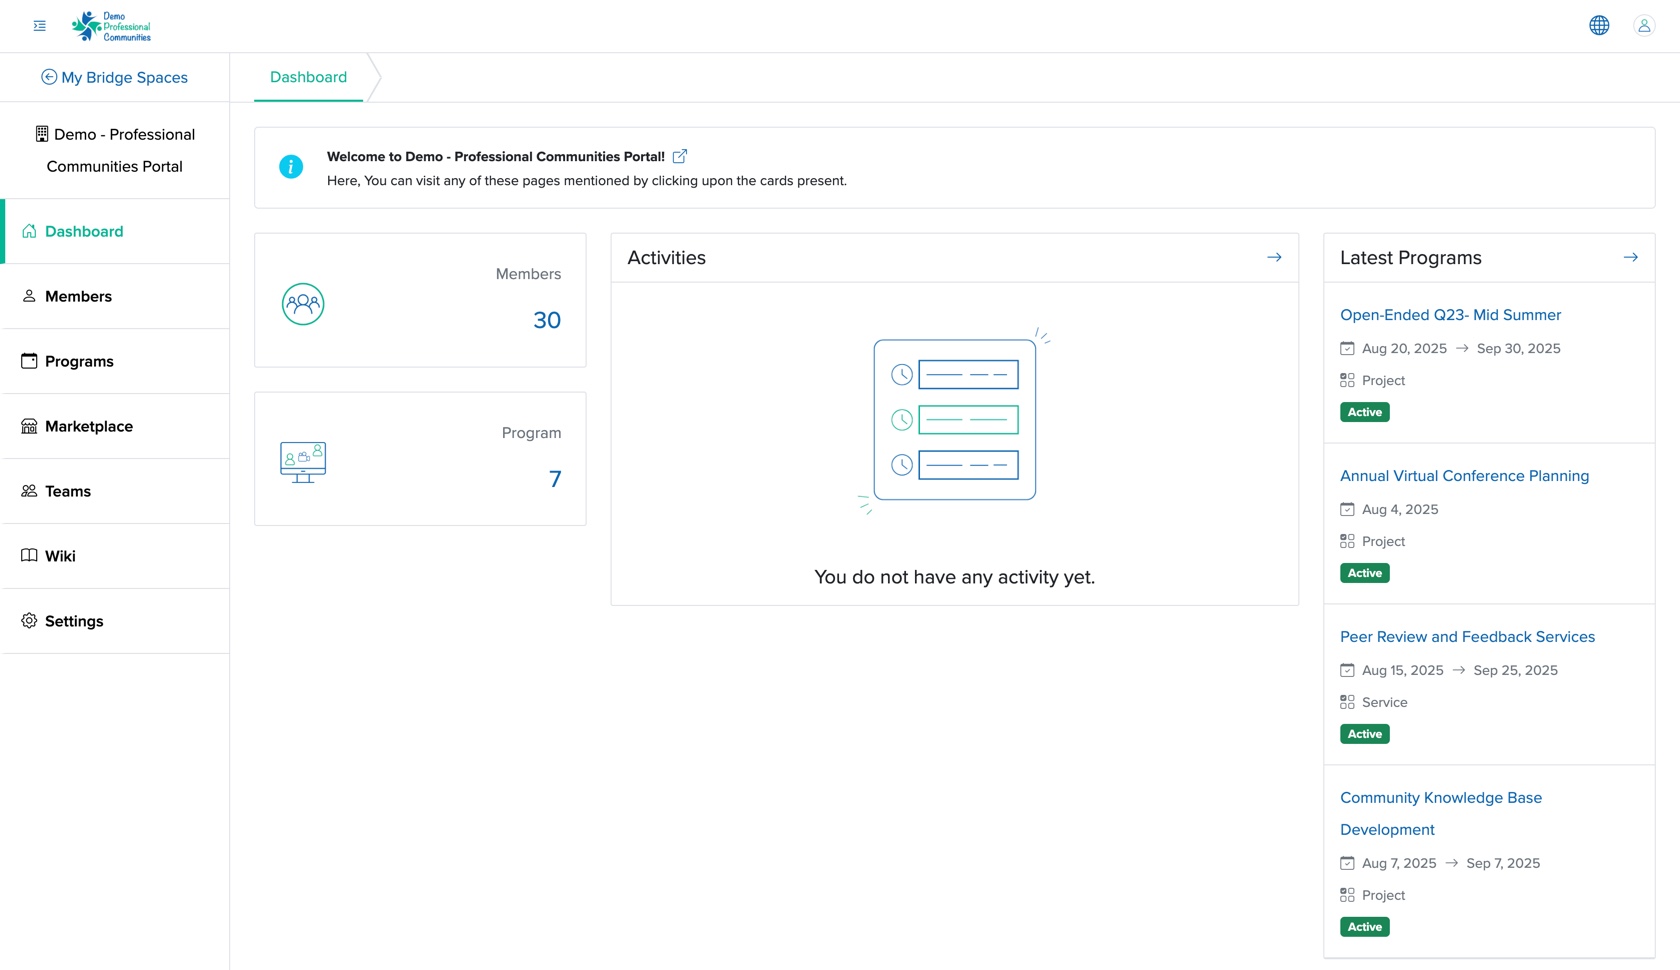
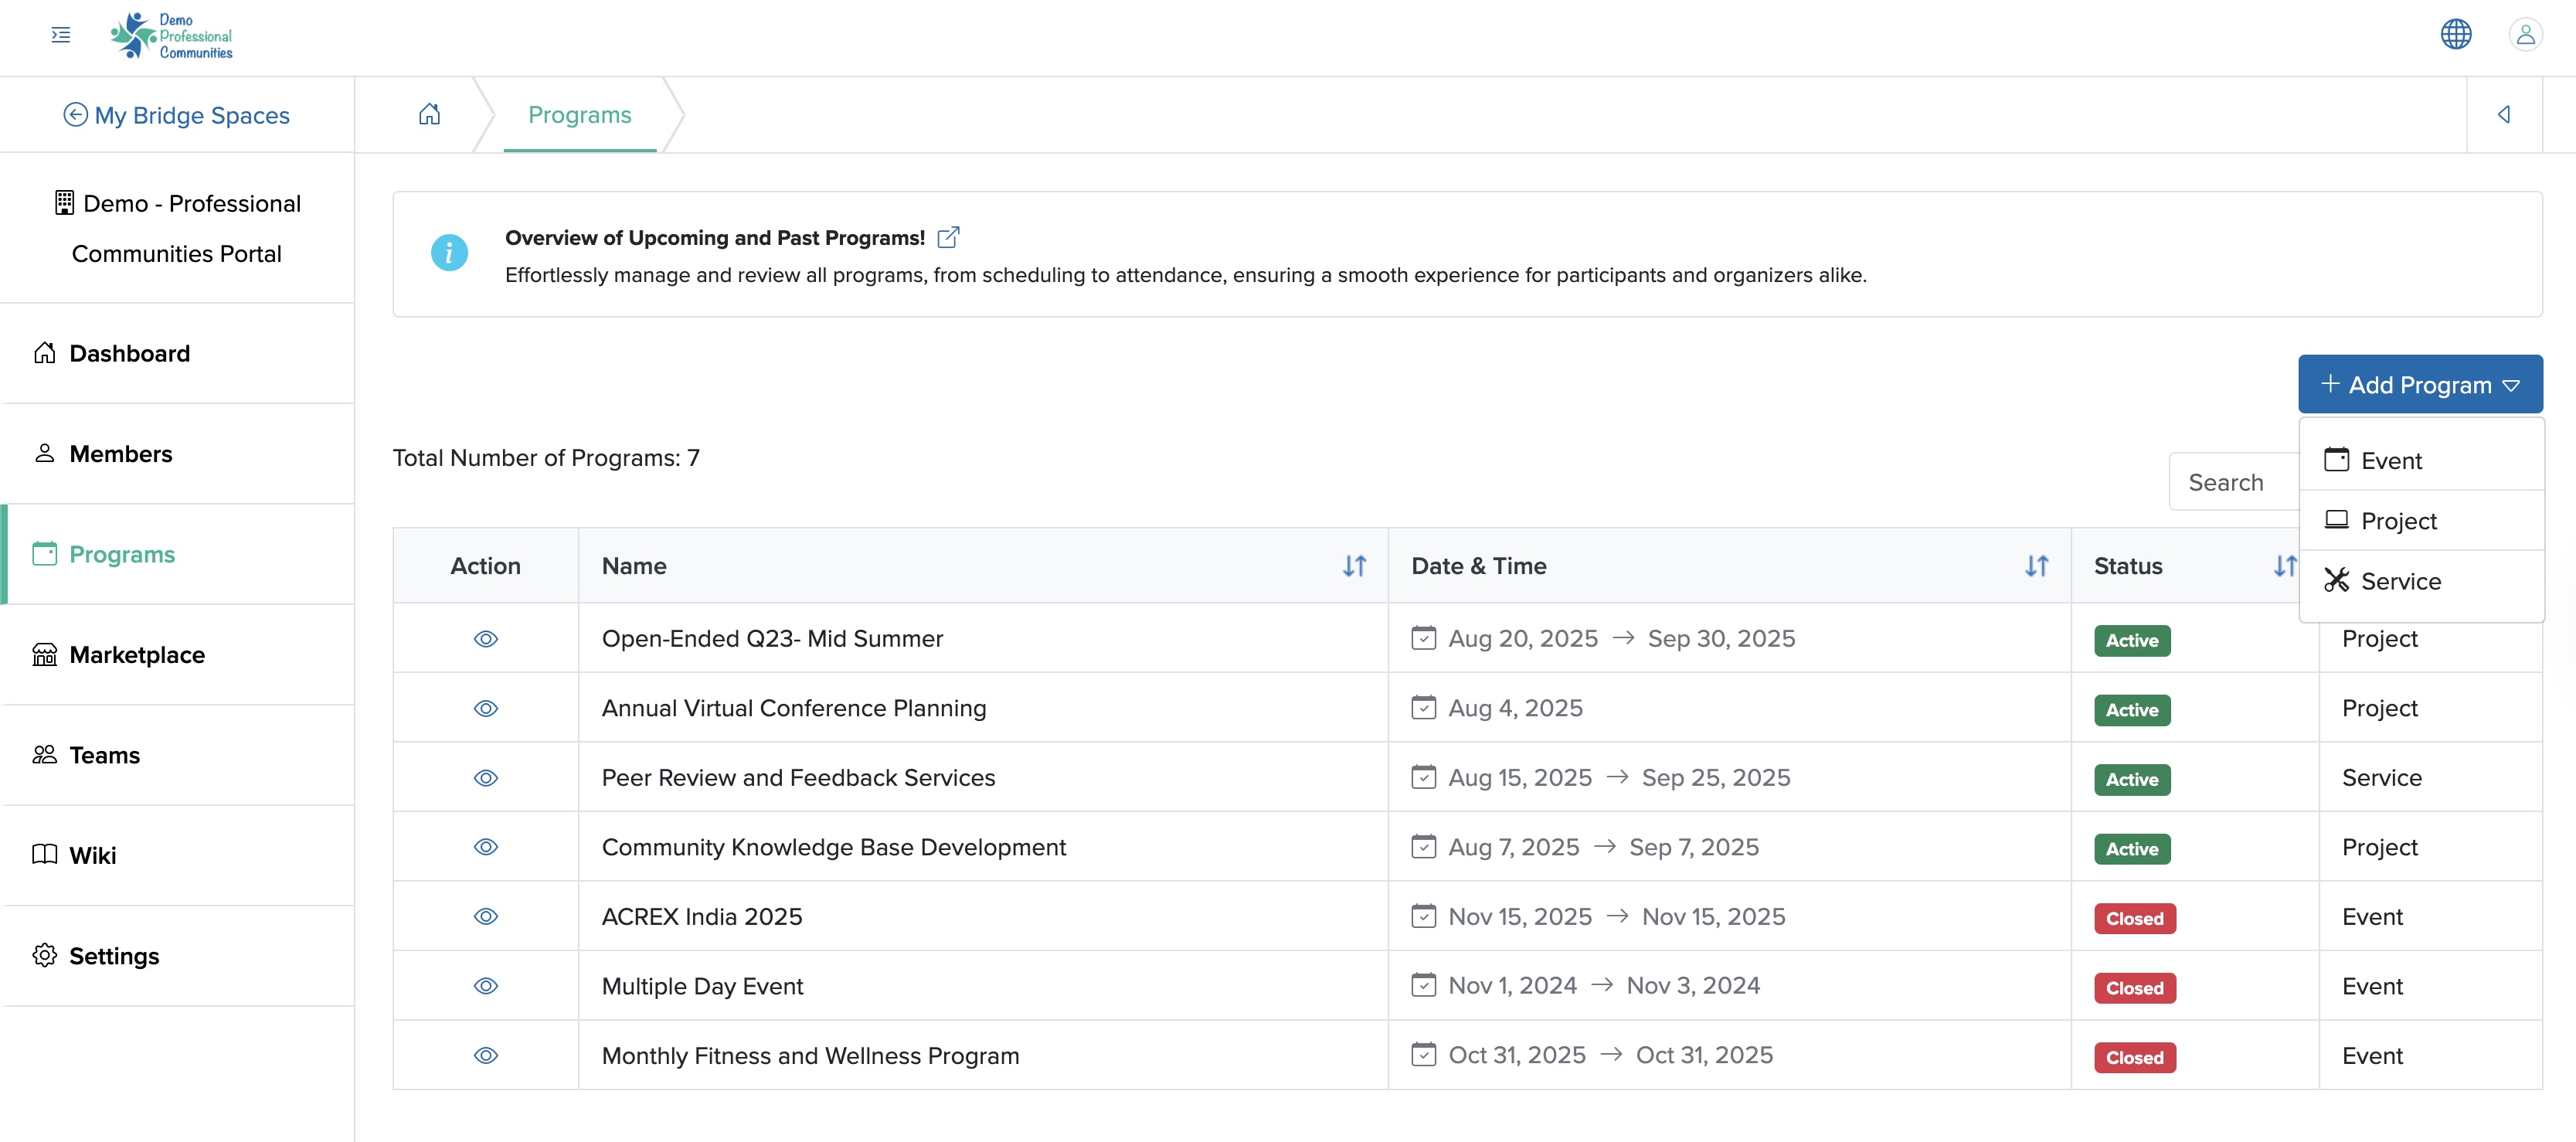
When we click the Programs menu from the Manager Control Panel dashboard, as shown in Figure 1 above, the system redirects us to the program list page, as shown in Figure 2 below.
Add Service
We can click the + Add Program button at the top right of the program dashboard screen, as shown in Figure 2 above, select the Service option from the dropdown menu, as shown in Figure 2 above, and the project add screen opens, as shown in Figure 3 below.
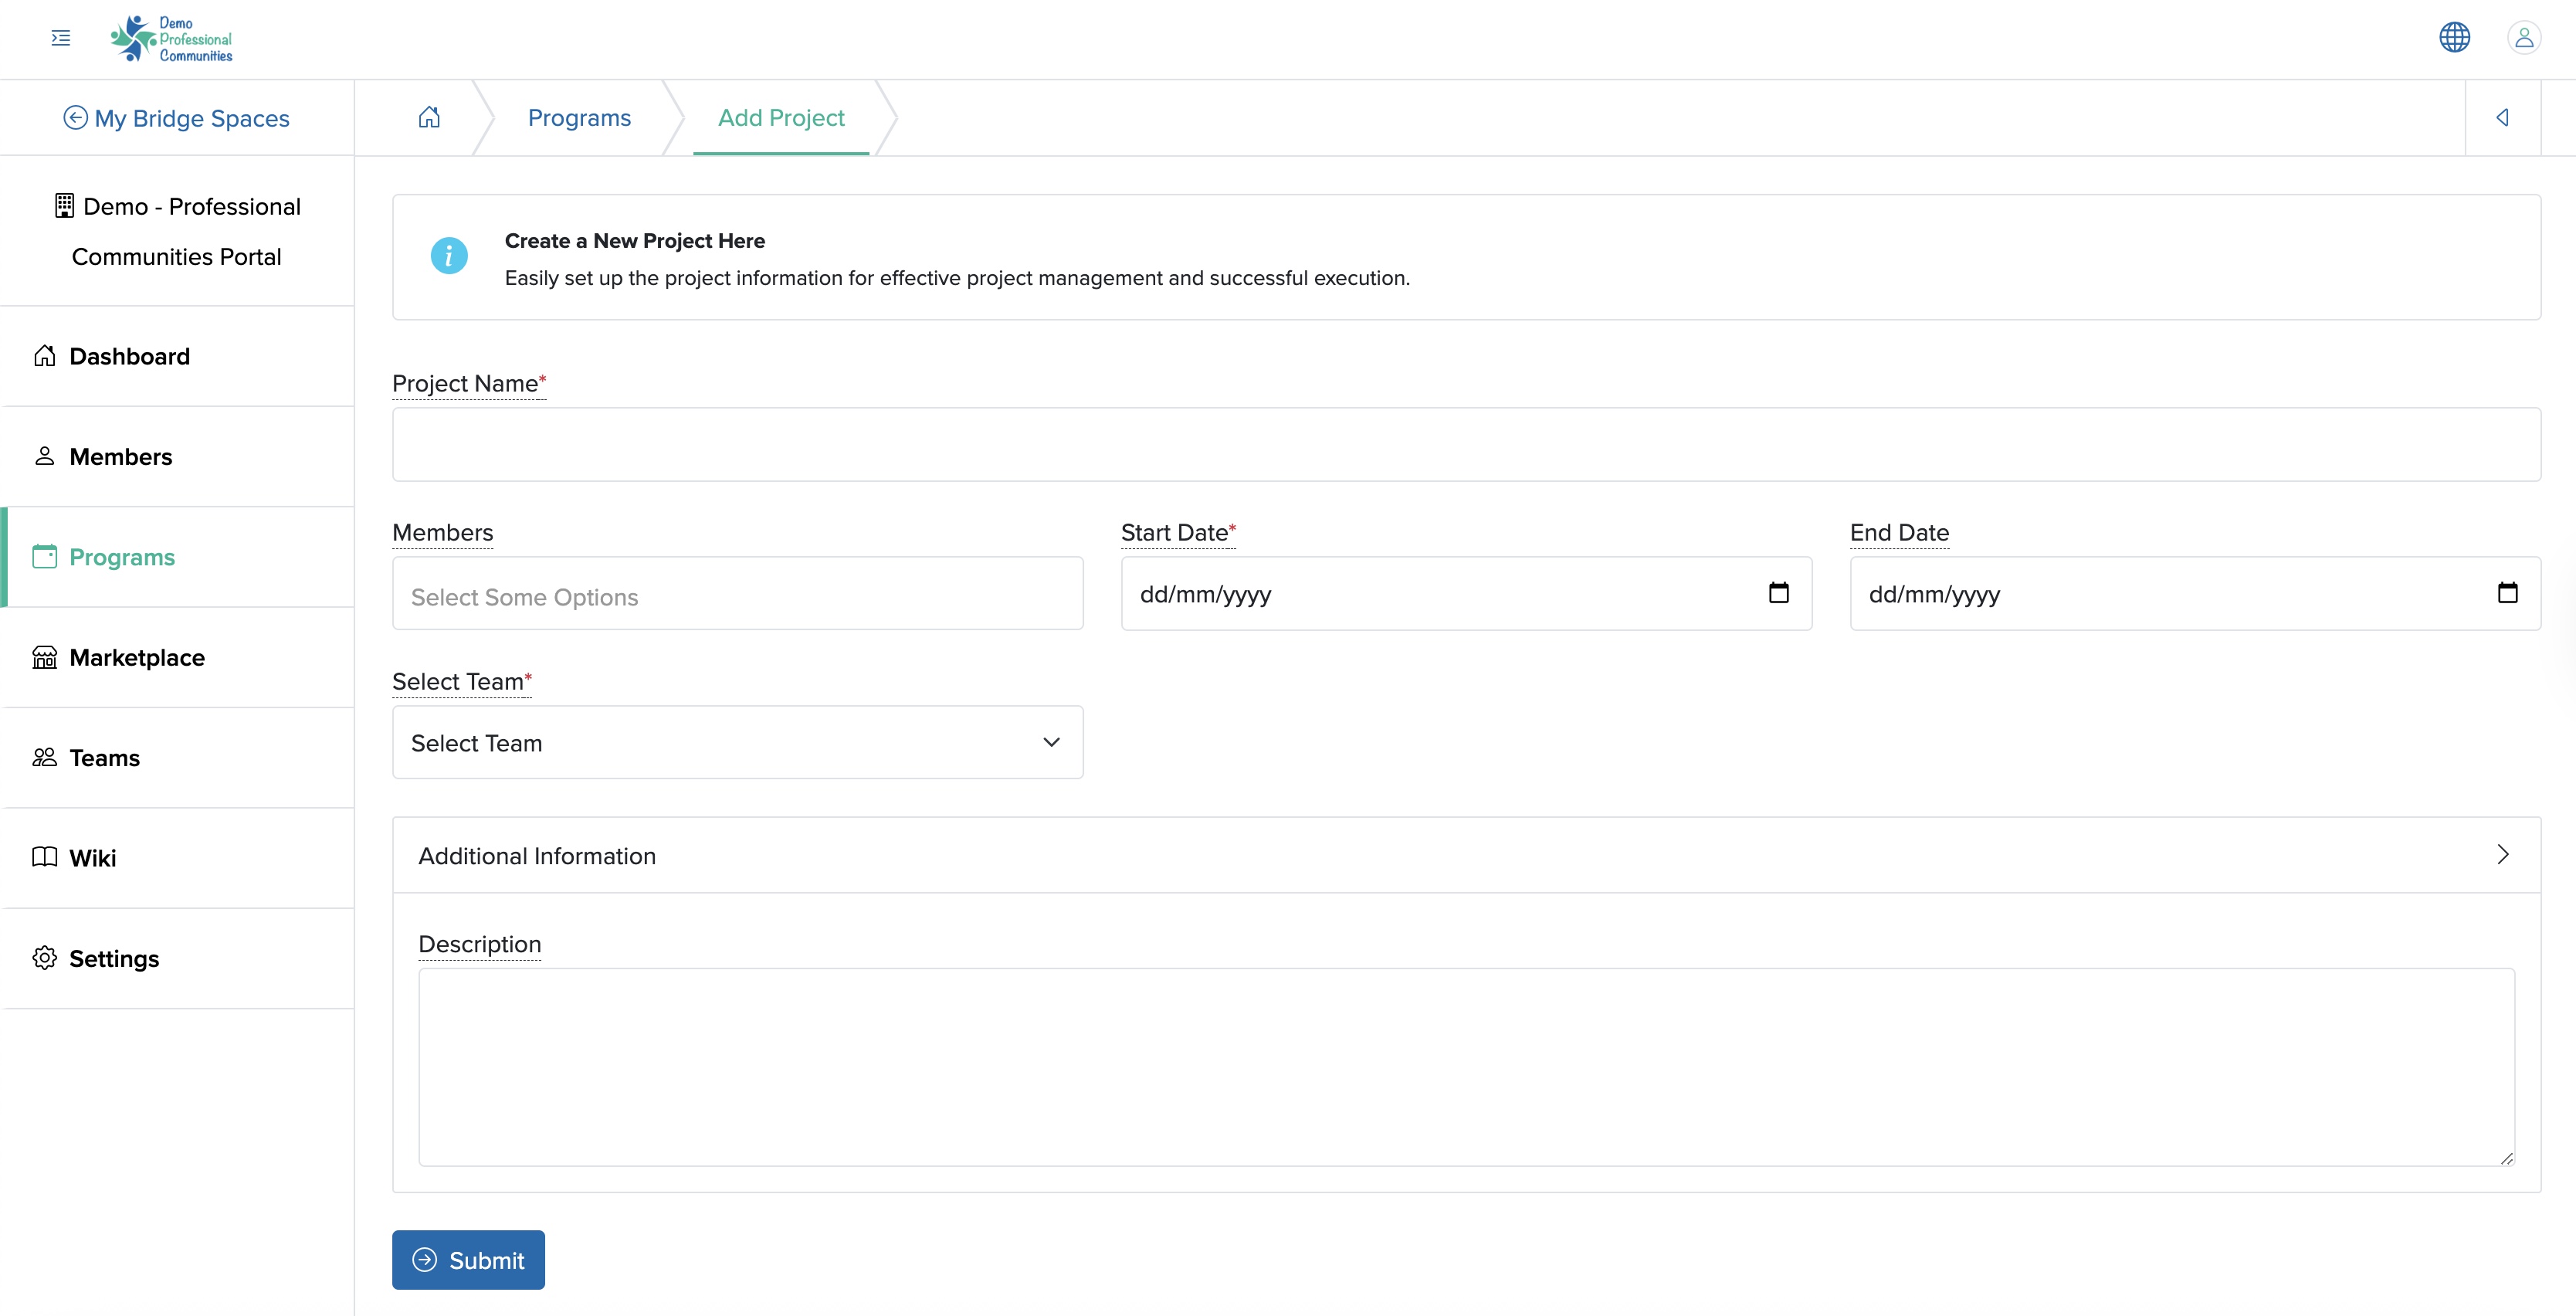
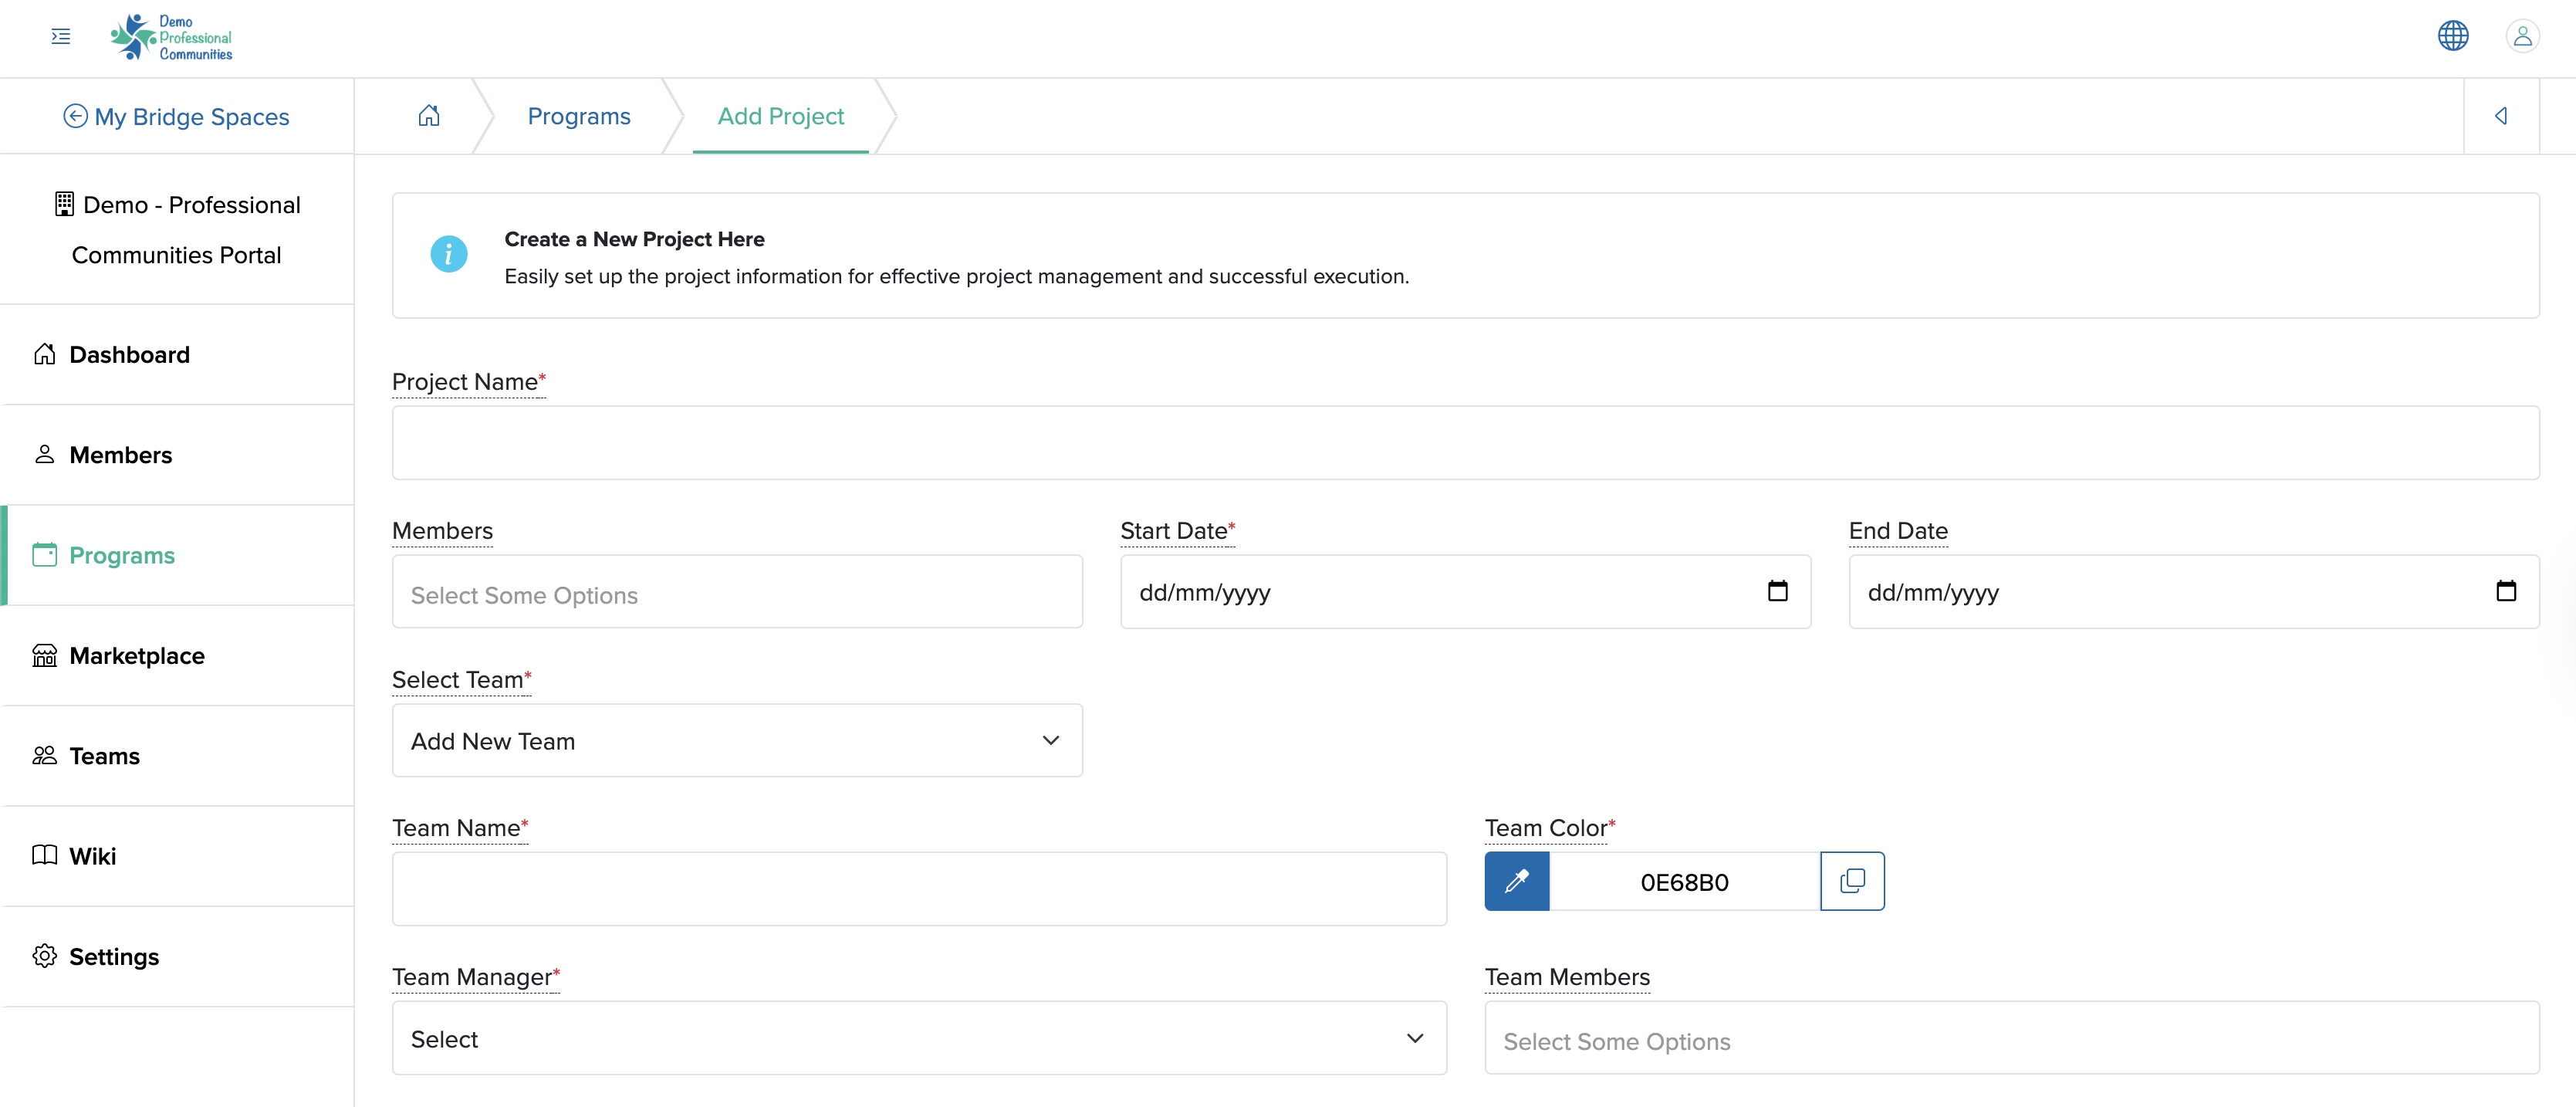
We can enter the details below and click the Submit button to create a new service, as shown in Figure 3 above. The details that can be added are:
- Service Name (Textbox - Mandatory): Title of the Service
- Start Date (Date Picker - Mandatory): We can select the date when the service will begin
- End Date (Date Picker - Mandatory): We can select the date when the service will be completed
- Select Team (Select Box - Mandatory): We can select the team for the service. If the desired team is not listed in the drop menu, we can select the option to Add New Team, and the fields to add a team will appear, as shown in Figure 4 below
- Description (Text Area - Optional): We can provide an overview or key details about the service to members associated with the program
As shown in Figure 3 above, we can click the Back icon at the top right of the screen to return to the program list page.
Individual Service Dashboard
We can click the View icon associated with each service on the action column of the respective service, as shown in Figure 2 above, and the service dashboard opens, as shown in Figure 5 below.
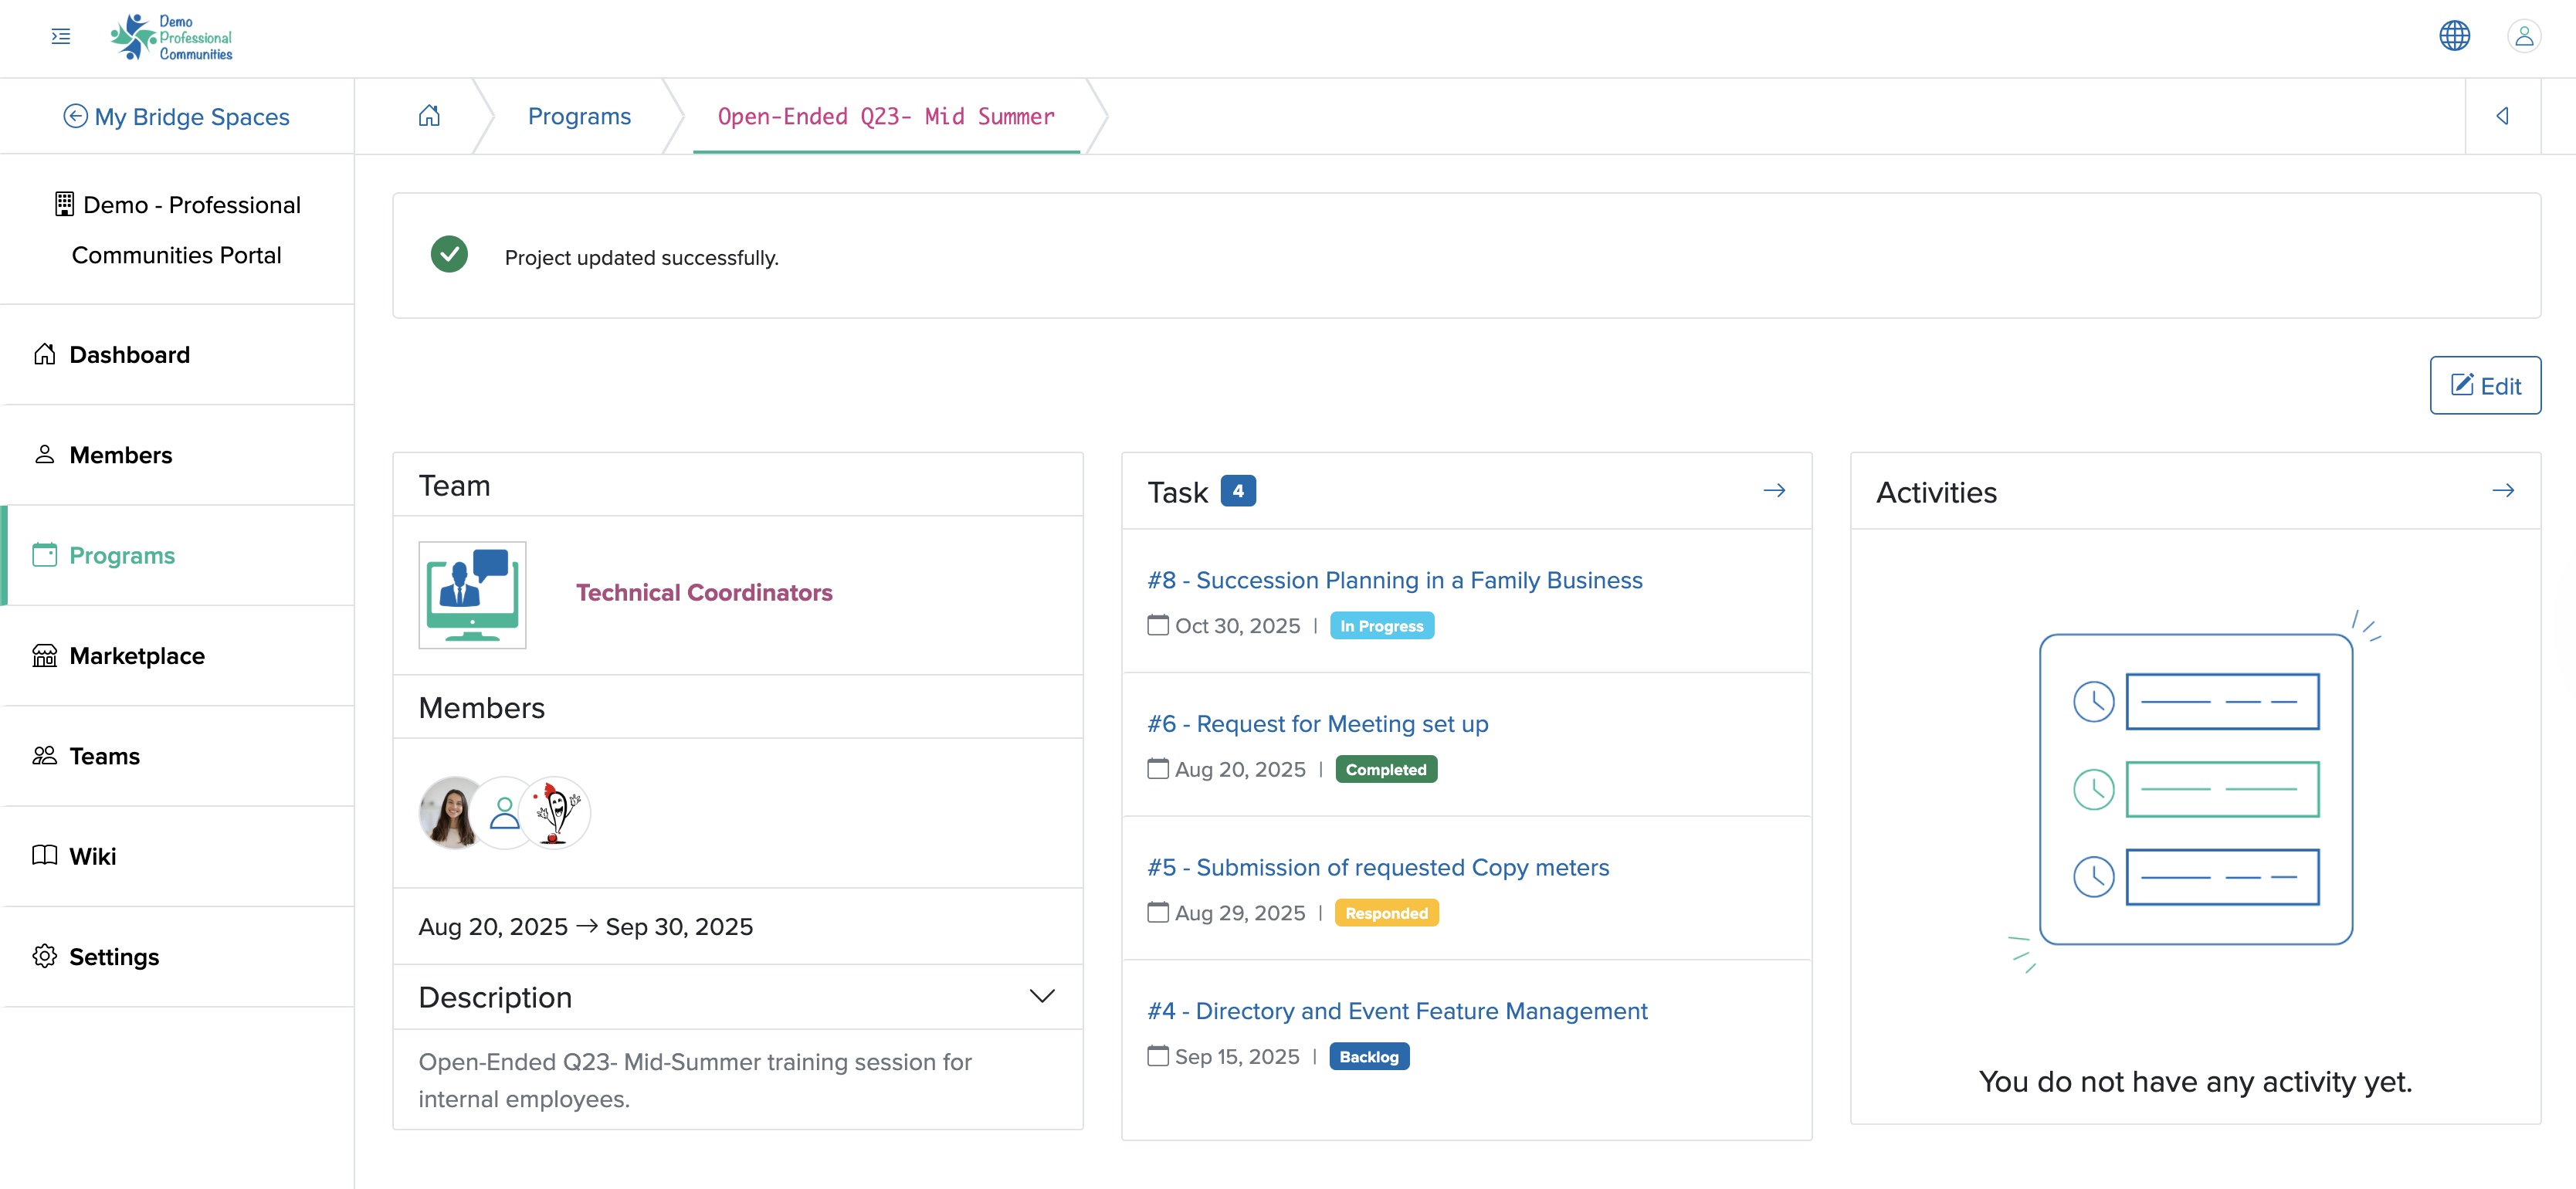
The service dashboard consists of three sections.
The left section displays the team name and logo at the top, followed by team members' details and the service timeline. The bottom part of the left section displays the service description, as shown in Figure 5 above.
The middle section displays the tickets associated with the service. We can also view all the tickets list by clicking the arrow on the ticket header, as shown in Figure 5 above.
The right section displays the activities related to the service. We can also view all the activity list by clicking the arrow on the activity header, as shown in Figure 5 above.
Edit Service
We can click the Edit button on the top right side of the service dashboard screen, as shown in Figure 5 above, and the service edit page opens, as shown in Figure 6 below.
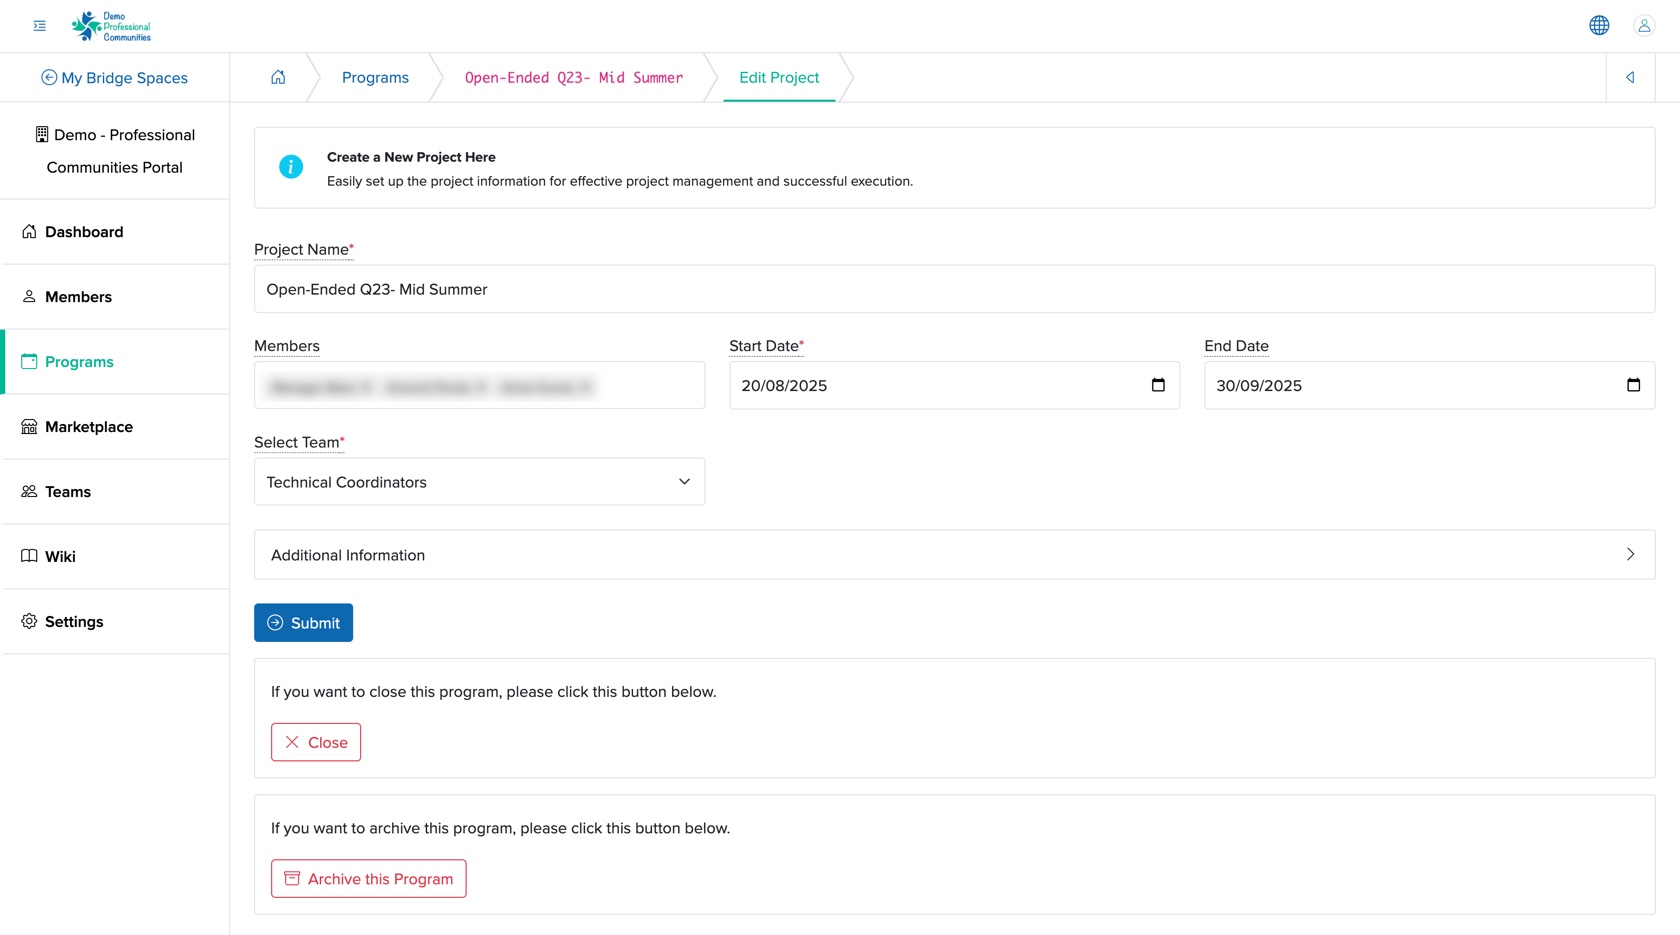
We follow a similar process to edit a service as we do to add one. We can follow the steps mentioned in Add Service to edit the service details.
We can close the service by clicking the Close button at the bottom of the Edit service screen, as shown in Figure 6 above.
We can archive the service by clicking the Archive this Program button at the bottom of the Edit Service screen, as shown in Figure 6 above.
Individual Service Ticket Dashboard
We can click the arrow on the ticket header on the service dashboard, as shown in Figure 5 above, and the ticket dashboard for the particular service opens, as shown in Figure 7 below.
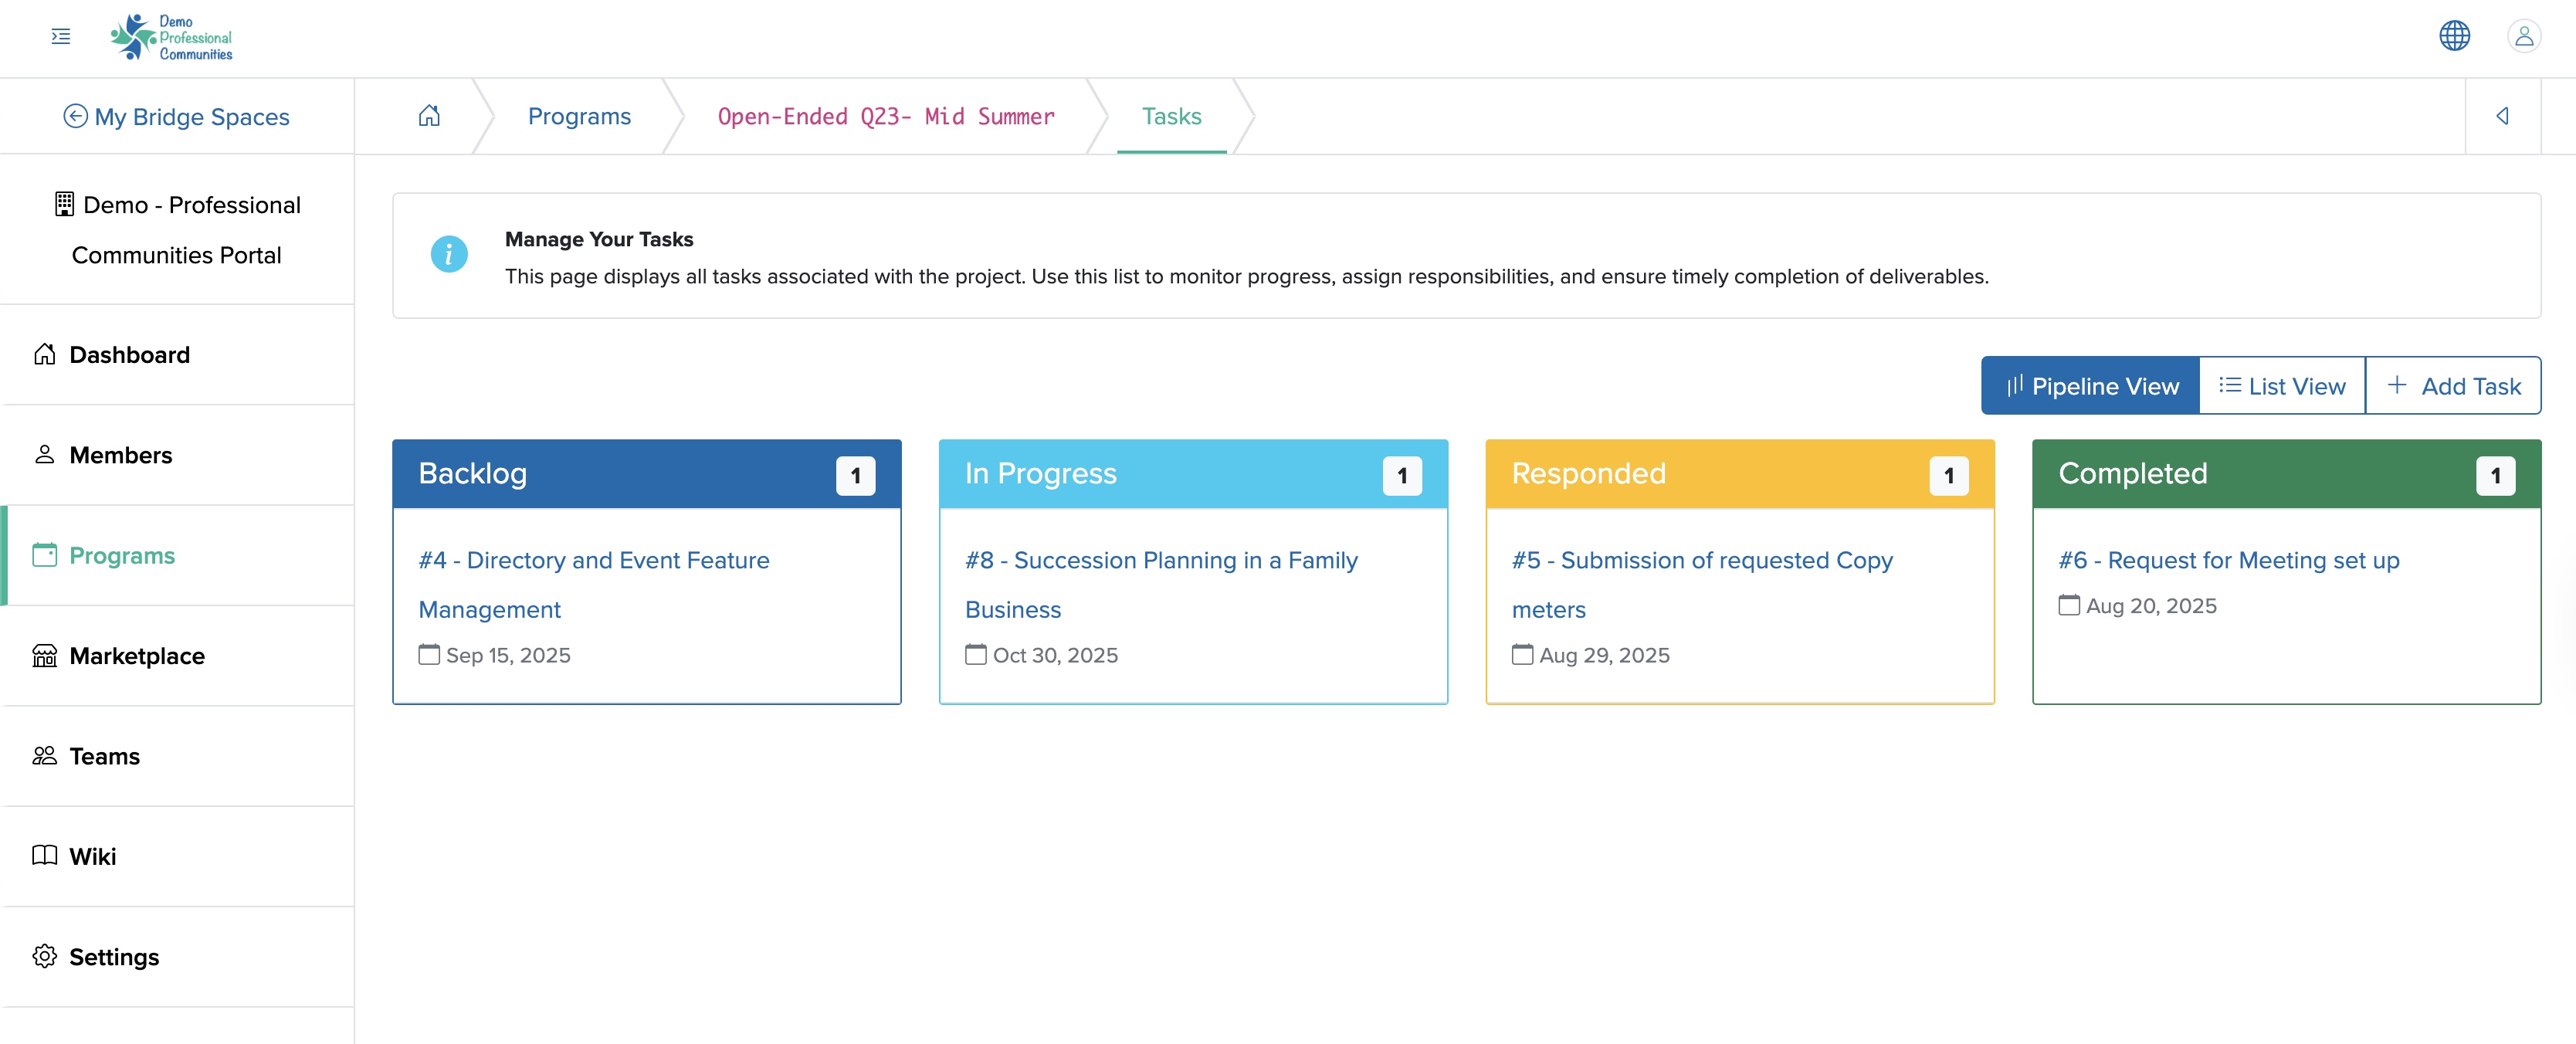
We can view the ticket dashboard in pipeline or list view by clicking the Pipeline or List buttons, as shown in Figure 7 above.
The pipeline view displays tickets in four different cards, categorized as 'Backlog', 'In Progress', 'Responded', and 'Completed', each with a distinct color, as shown in Figure 7 above.
The list view displays tickets in a tabular format detailing the 'Action', 'Title', 'Status', and 'Timeline', as shown in Figure 8 below.
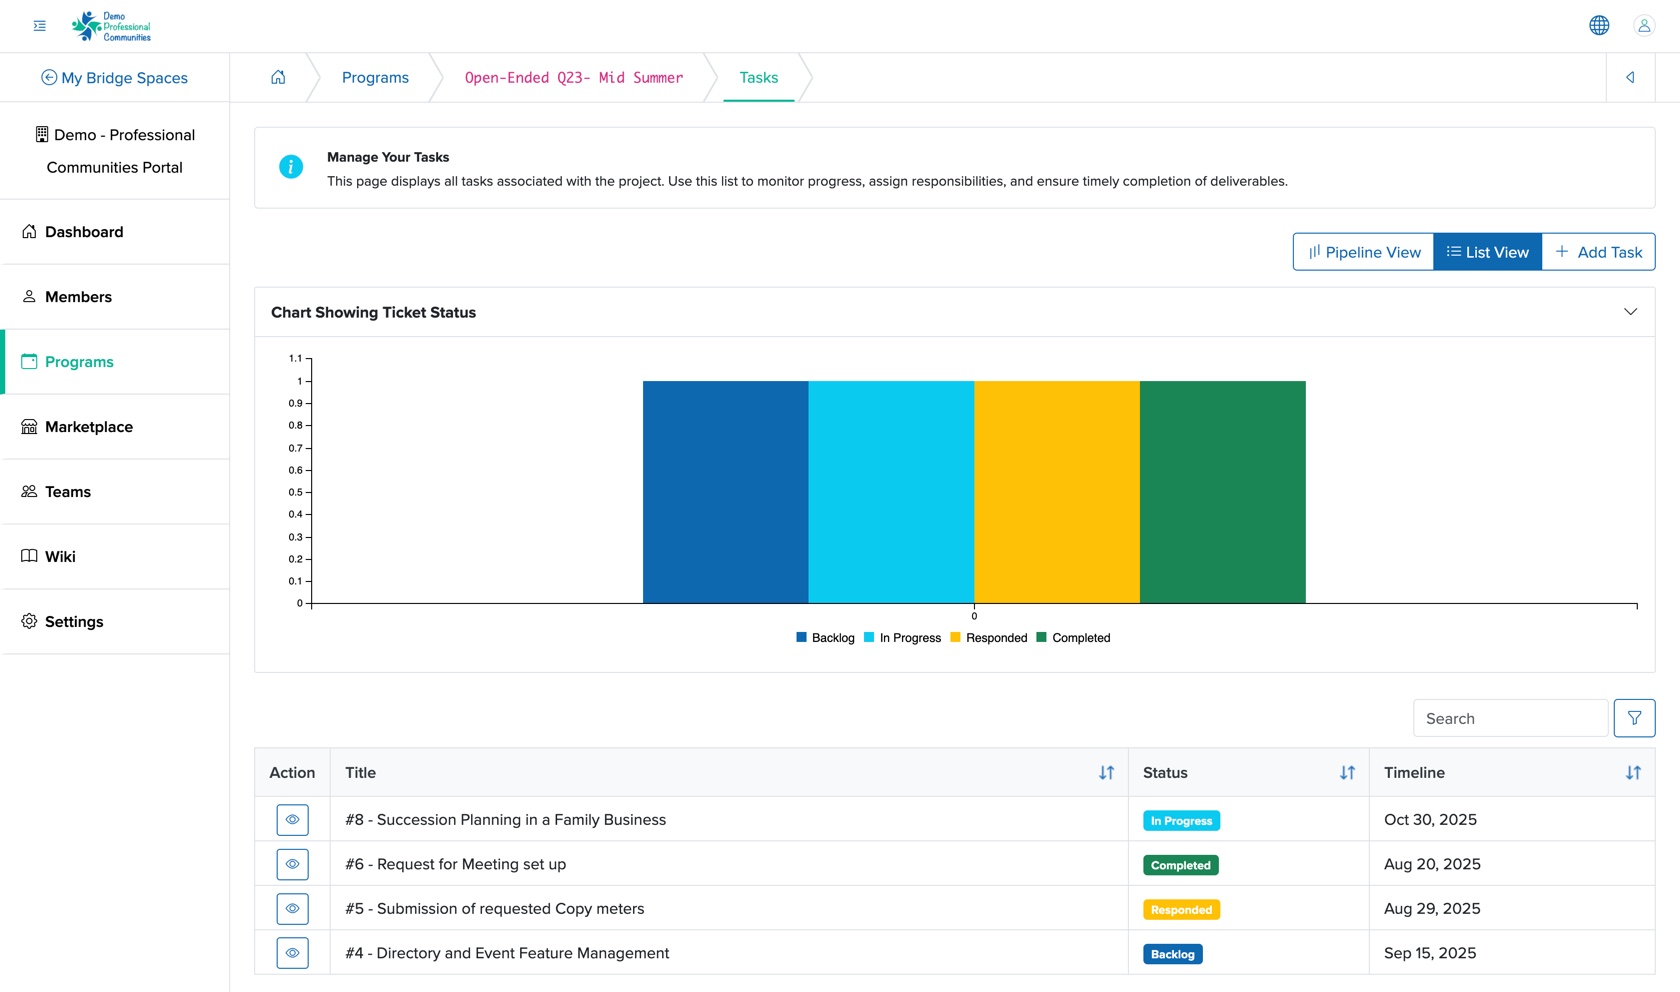
We can click the arrow on the header Chart Showing Ticket Status to view the ticket status chart, and the section expands to display the chart, as shown in Figure 8 above.
We can filter the table data by clicking the arrow associated with the header row of the table, as shown in Figure 8 above.
We can enter the details in the filter textbox and click the filter button just above the table header to filter the data, as shown in Figure 8 above.
We can view the status of the ticket in the status column of the table, as shown in Figure 8 above.
Add Ticket to Service
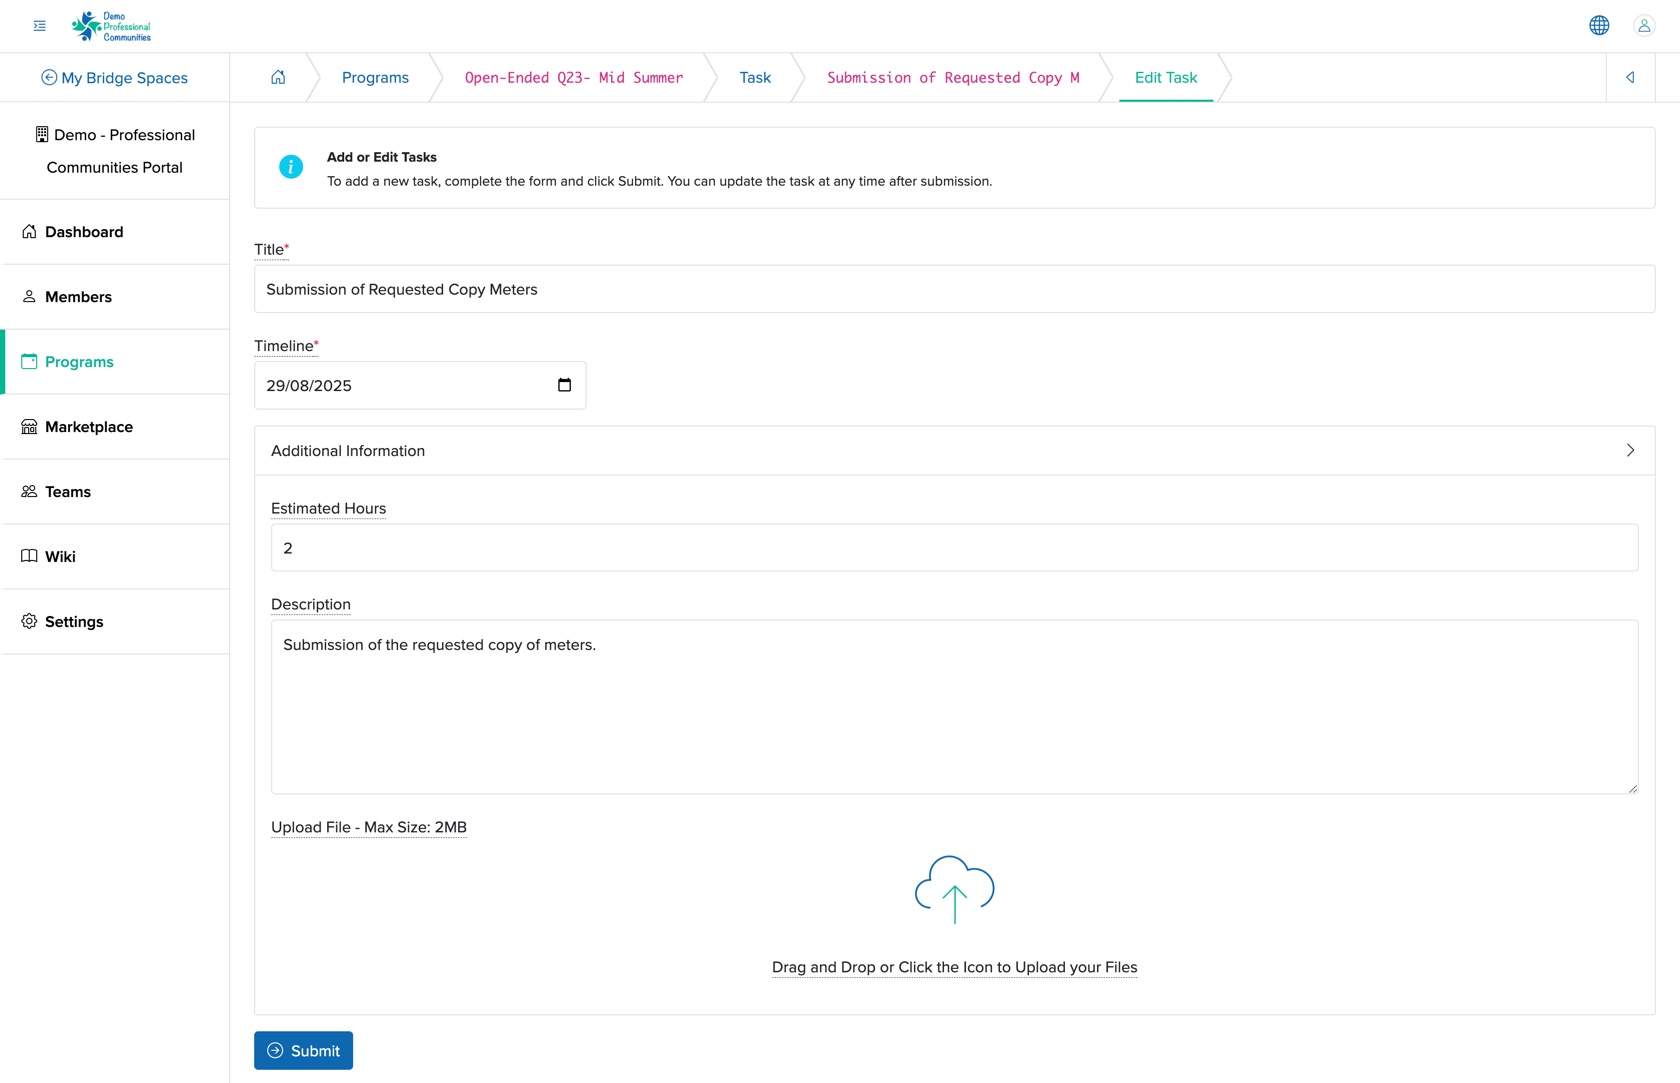
We can click the + Add Ticket button on the ticket dashboard of the particular service, as shown in Figure 7 above, and the add ticket page opens, as shown in Figure 9 below.
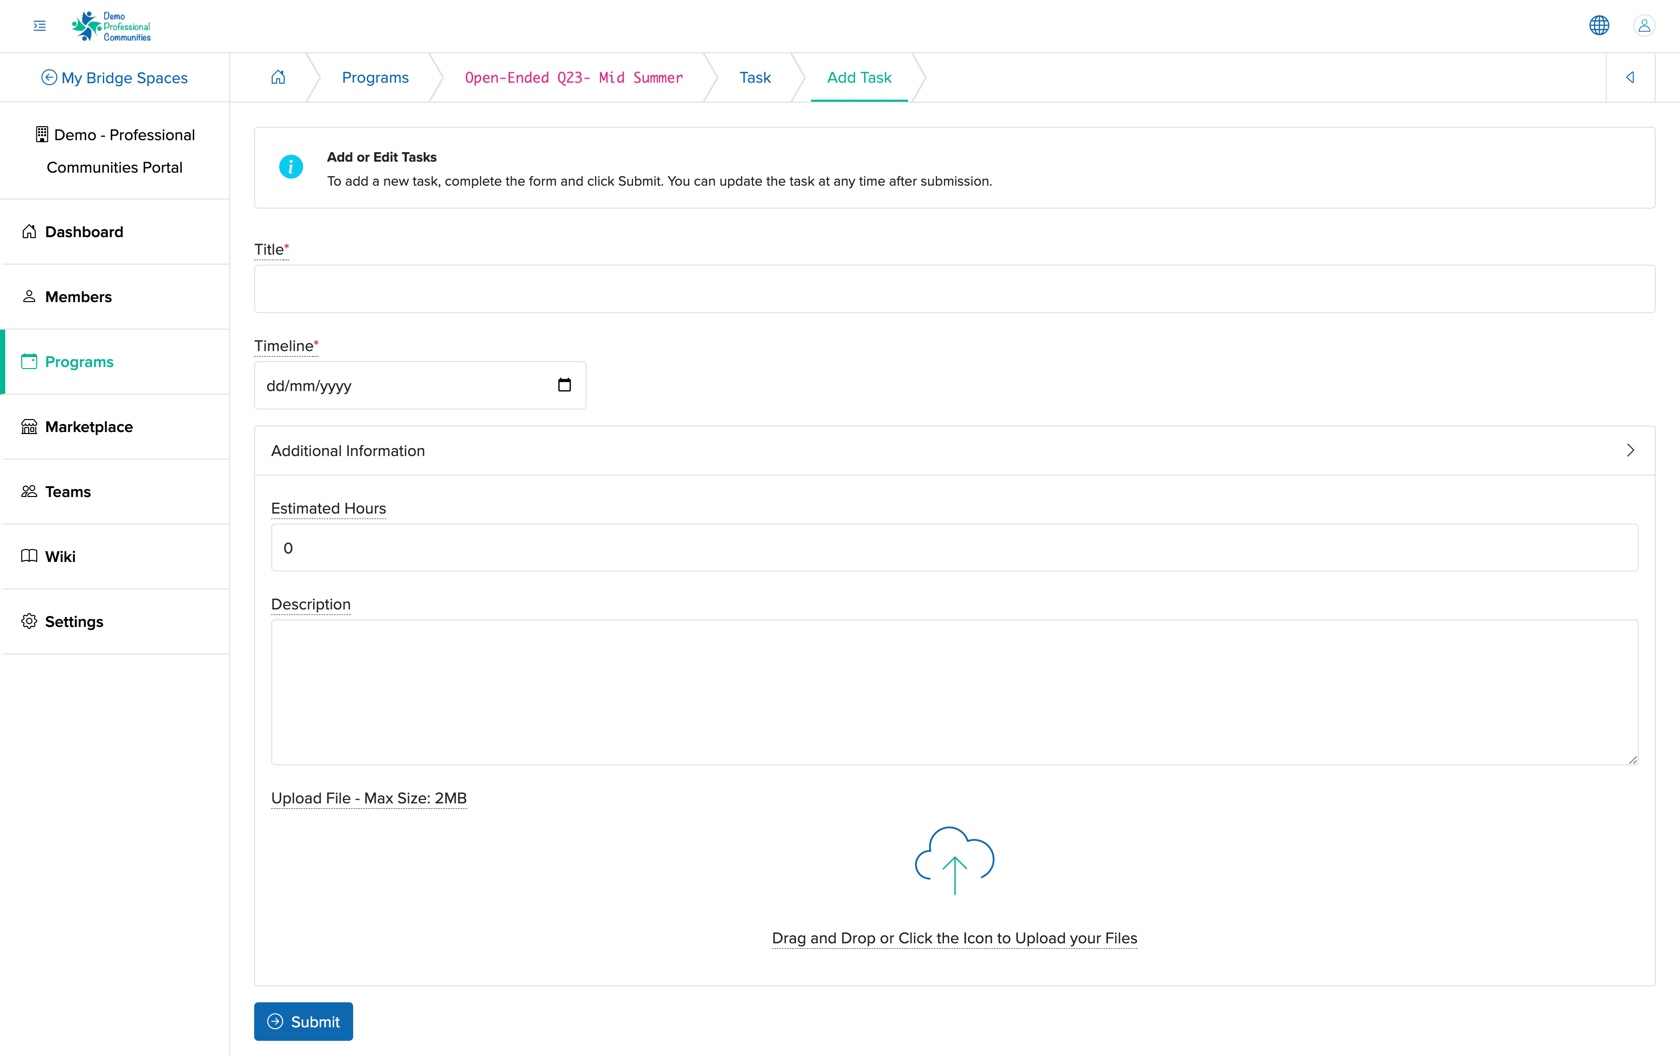
We can enter the details below and click the Submit button to create a new ticket, as shown in Figure 9 above. The details that can be added are:
- Title (Textbox - Mandatory): Title of the Ticket
- Timeline (Date Picker - Mandatory): We can select the expected date for the completion of the ticket
- Estimated Hours (Select Box - Optional): We can select the expected duration required to complete the ticket
- Description (Text Area - Optional): We can provide an overview of the ticket
- Upload (File upload - Optional): We can upload any document related to the ticket with a maximum limit of 2 MB
Once we create a ticket, it will be marked by default as Backlog ticket in the ticket list page.
View Ticket Log
We can click the Ticket Title if we are in the pipeline view of the ticket dashboard, or we can click the View icon associated with the individual ticket row if we are in the list view of the ticket dashboard, as shown in Figure 8 above. The particular ticket log page will open, as shown in Figure 10 below.
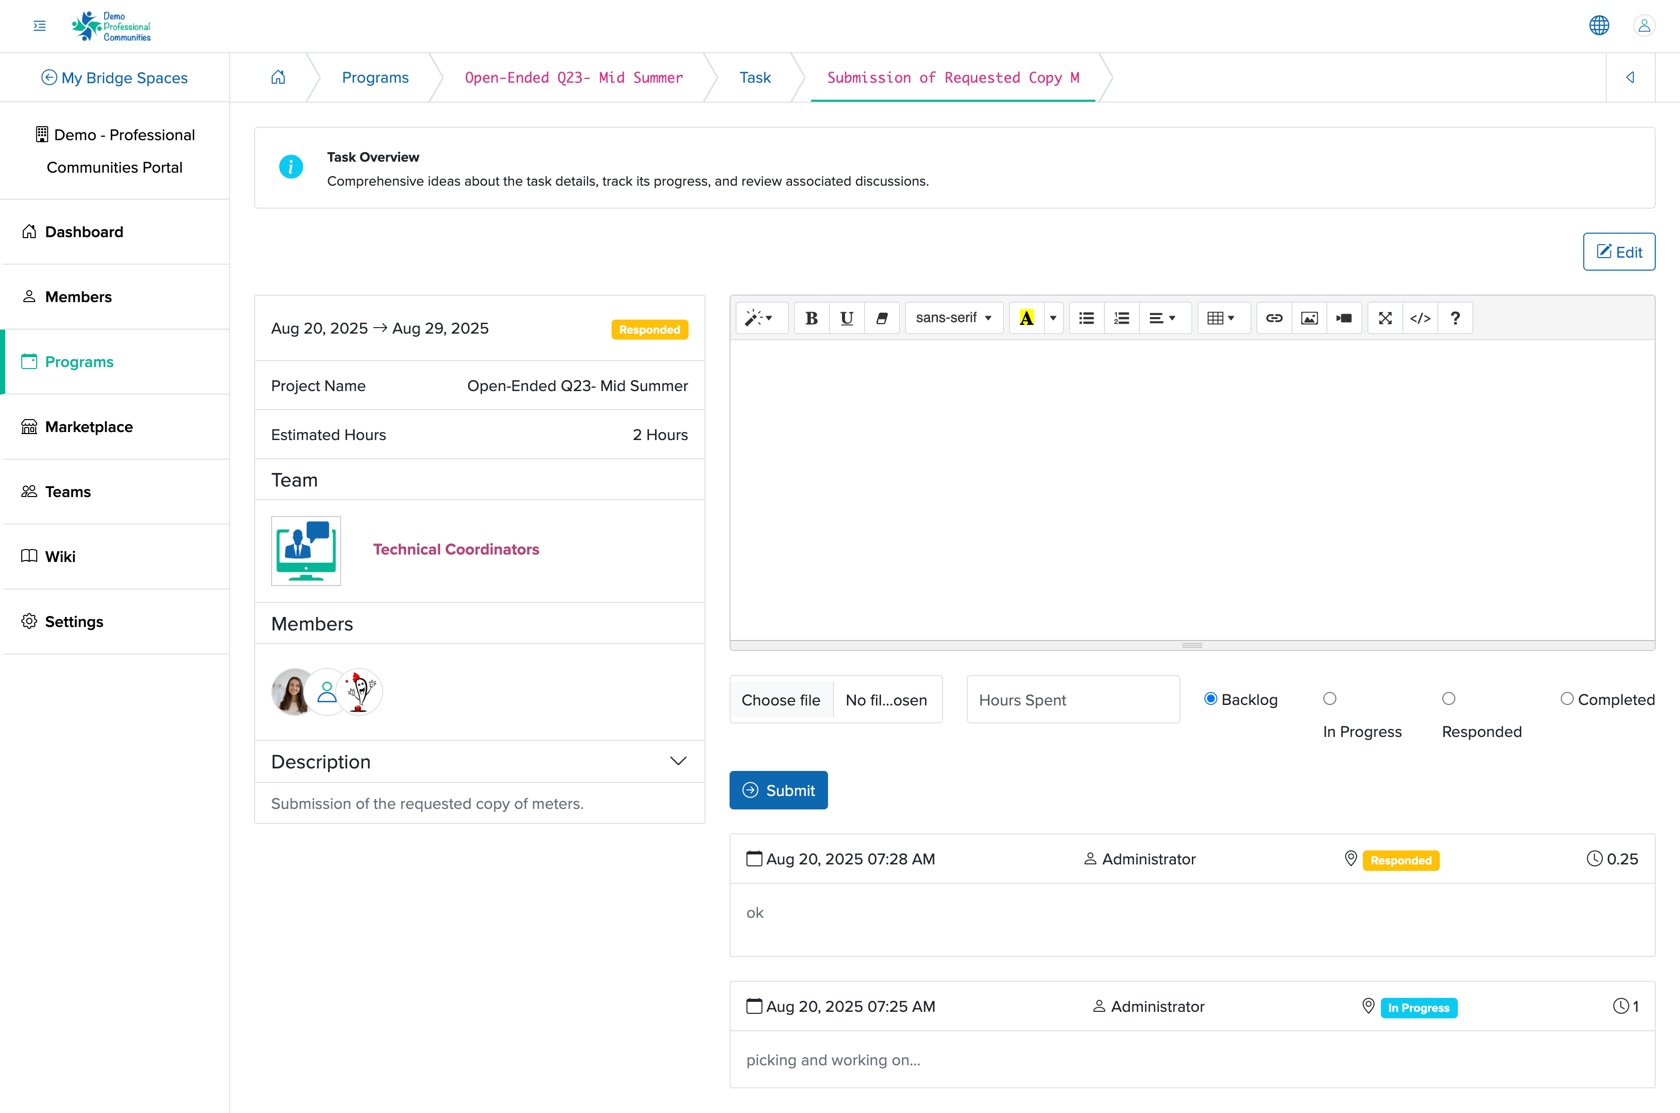
The ticket log screen consists of all vital information about the particular ticket on the left side and an add log section on the right side, as shown in Figure 10 above.
To add a new log to the ticket, we can enter the details in the Text Editor on the right side of the screen and click the Submit button. To change the ticket status, click the Ticket Type radio button just above the Submit button, as shown in Figure 10 above.
Edit Ticket Under a Service
We can click the Edit button on the top right side of the ticket log screen, as shown in Figure 10 above, and the Edit Ticket page opens, as shown in Figure 11 below.